Question
[Maximum mark: 18]
The table shows the length, in km, of an Uber ride in New York City and the corresponding price, in USD, of the ride.
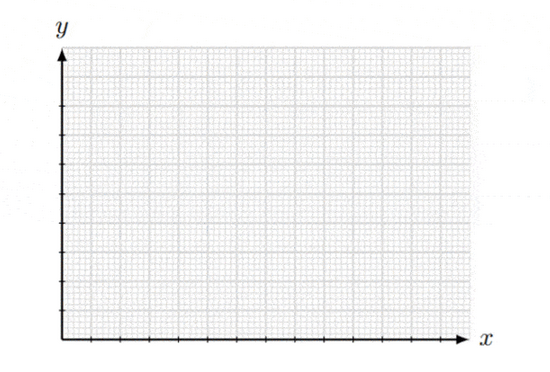
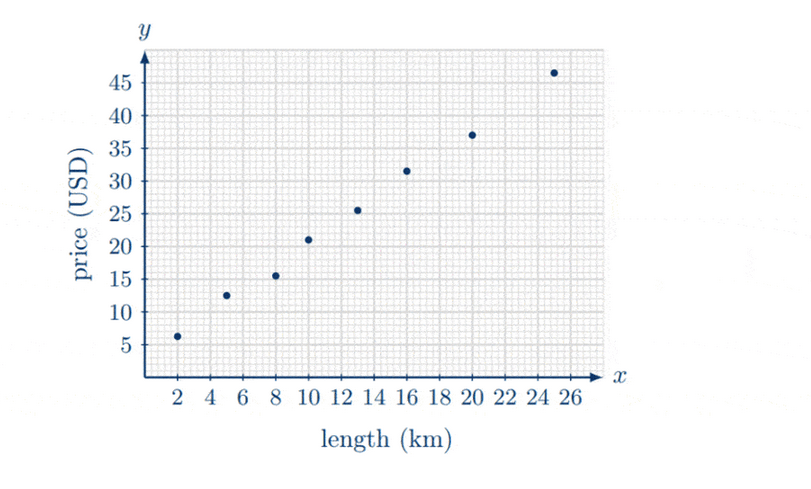
(a) Draw a scatter diagram for the above data on the axes below. Use a scale of 1 unit to represent $2 \mathrm{~km}$ on the $x$-axis and 1 unit to represent 5 USD on the $y$-axis. [4]

(b) Use your graphic display calculator to find
(i) $\bar{x}$, the mean of the lengths;
(ii) $\bar{y}$, the mean of the prices. [2]
(c) Plot and label the point $\mathrm{M}(\bar{x}, \bar{y})$ on your scatter diagram. [1]
(d) Use your graphic display calculator to find
(i) the product-moment correlation coefficient, $r$;
(ii) the equation of the regression line $y$ on $x$. [3]
(e) Draw the regression line $y$ on $x$ on your scatter diagram. [2]
John took a Uber ride of length $22.5 \mathrm{~km}$ from John F. Kennedy International Airport (JFK) to Central Park.
(f) Use the equation of the regression line to estimate the price of John’s ride from JFK to Central Park. Give your answer correct to the nearest dollar. [3]
(g) Give a reason why it is valid to use your regression line to estimate the price of John’s ride. [1]
The actual cost of John’s Uber rise was 40 USD.
(h) Using your answer to part (f), calculate the percentage error in the estimated price of John’s ride. [2]
Answer/Explanation
(a) The scatter plot is as follows.

Question
[Maximum mark: 14]
The water depth, $D$, in metres, at the entrance of a boating harbour can be modelled by the function
$$
D(t)=4.5 \cos \left(30^{\circ} \times t+90^{\circ}\right)+15,0 \leq t \leq 24,
$$
where $t$ is the elapsed time, in hours, since midnight.
(a) Write down the depth of water at midnight. [1]
(b) The cycle of water depths repeats every T hours. Find the value of T. [2]
(c) (i) Write down the minimum and maximum depths of water during the day.
(ii) Find the times at which the minimum and maximum depths of water occur during the day. [4]
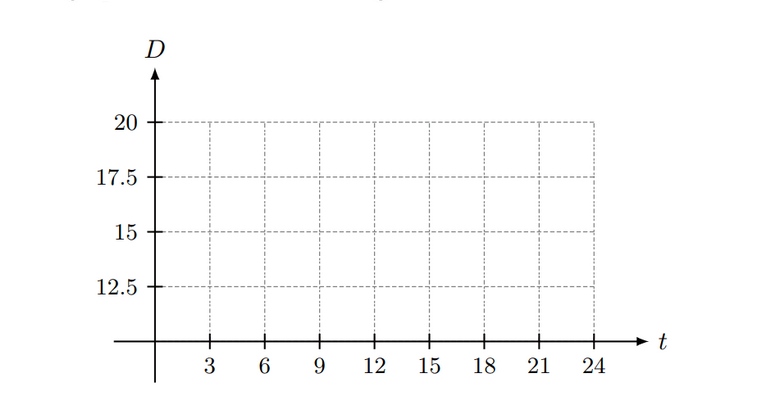
(d) Draw the graph of $D$ versus $t$ on the grid below. [3]

(e) A ship with $10 \mathrm{~m}$ draught is allowed to enter the harbour if the depth of water is greater than $12 \mathrm{~m}$. Find the time interval after midday, in hours and minutes, during which the ship is not allowed to enter the harbour. [4]
Answer/Explanation
(a) $15 \mathrm{~m}$
(b) We have
$
\begin{aligned}
T & =\frac{360}{30} \\
& =12
\end{aligned}
$
(c) (i) The min and max values of the cosine function are $-1$ and $+1$. Hence the min and max depths of water are
$
\begin{aligned}
D_{\min } & =4.5(-1)+15 \\
& =10.5 \mathrm{~m} \\
D_{\max } & =4.5(+1)+15 \\
& =19.5 \mathrm{~m}
\end{aligned}
$
(ii) Solving the equation $D(t)=10.5$ for $t$, we have
$
\begin{aligned}
4.5 \cos \left(30^{\circ} \times t+90^{\circ}\right)+15 & =10.5 \\
t & =3,15\quad\quad\text{[by using G.D.C.]}
\end{aligned}
$
Hence the min depth of water occurs at 3 am and 3 pm
