Question
[Maximum mark: 6]
Peter owns a diary farm in New Plymouth, New Zealand, where hundreds of cows are bred for milk. In an effort of evaluating the cows productivity, he recorded the amount of milk that the cows produce over several days. The following box-and-whisker diagram represents the summary of the data.
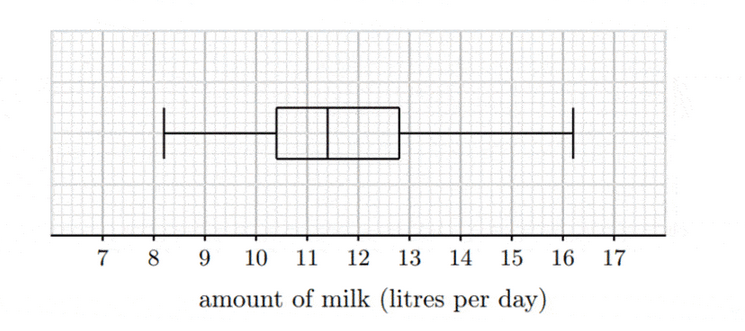
(a) Write down the median amount of milk that a diary cow produces per day at his farm. [1]
(b) Write down the lower and upper quartiles. [2]
(c) Find the interquartile range. [1]
The amount of milk that these cows produce each day is known as being normally distributed.
(d) Find the lowest amount of milk that a cow can produce and still not be considered an outlier. [2]
Answer/Explanation
(a) Let’s label the five summary numbers on the given box-and-whisker diagram.
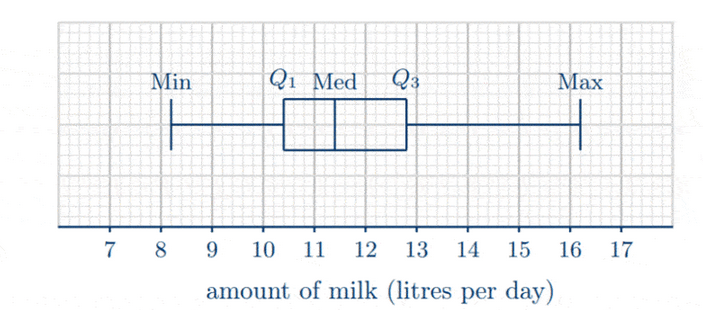
Hence, median $=11.4$ litres per day.
(b) $Q_1=10.4$ litres per day
$Q_3=12.8$ litres per day
(c) The interquartile range is
$
\begin{aligned}
\mathrm{IQR} & =Q_3-Q_1 \\
& =12.8-10.4 \\
& =2.4
\end{aligned}
$
(d) A data value is identified as an outlier if it falls outside the interval $\left(Q_1-1.5 \times \mathrm{IQR}, Q_3+1.5 \times \mathrm{IQR}\right)$. Testing this interval, we get
$
\begin{aligned}
Q_1-1.5 \times \mathrm{IQR} & =10.4-1.5(2.4) \\
& =6.8
\end{aligned}
$
Hence, a diary cow must produce no less than $6.8$ litres of milk per day to not be considered as an outlier.
Question
[Maximum mark: 6]
In a school playground, the grass is watered by lawn sprinklers that are set to spray at an arc of $220^{\circ}$ with a maximum spray distance of 5 metres, as shown in the diagram below.
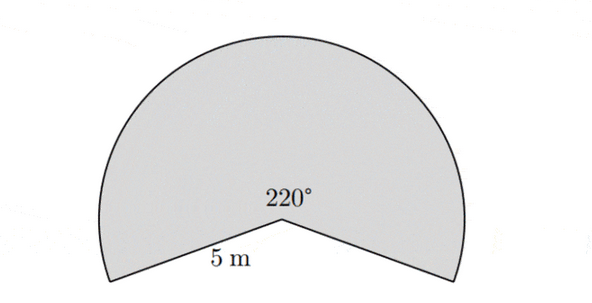
(a) Calculate the area of grass that is watered by this sprinkler. [3]
(b) Calculate the length of the sprinkler arc edge, where the maximum spray distance lands. [3]
Answer/Explanation
(a) Using the area of a sector formula, we get
$
\begin{aligned}
A & =\frac{\theta}{360} \pi r^2 \\
& =\frac{220}{360} \pi\left(5^2\right) \\
& \approx 48.0 \mathrm{~m}^2
\end{aligned}
$
(b) Using the length of an arc formula, we get
$
\begin{aligned}
l & =\frac{\theta}{360} 2 \pi r \\
& =\frac{220}{360} 2 \pi(5) \\
& \approx 19.2 \mathrm{~m}
\end{aligned}
$