IB DP Math MAI SL : IB Style Mock Exams – Set 7 Paper 1

Question

[Maximum mark: 6]
After solving a problem, John has an exact answer of $z=0.1475$.

(a) Write down the exact value of $z$ in the form $a \times 10^k$, where $1 \leq a<10, k \in \mathbb{Z}$.                                                                            [2]

(b) State the value of $z$ given correct to 2 significant figures.                                                                                                                                  [1]

(c) Calculate the percentage error if $z$ is given correct to 2 significant figures.                                                                                           [3]

Answer/Explanation

(a) $1.475 \times 10^{-1}$

(b) $0.15$

(c) Using the percentage error formula $\epsilon=\left|\frac{v_{\mathrm{A}}-v_{\mathrm{E}}}{v_{\mathrm{E}}}\right| \times 100 \%$ with $v_{\mathrm{E}}=0.1475$ and $v_{\mathrm{A}}=0.15$, we obtain
$
\begin{aligned}
\epsilon & =\left|\frac{0.15-0.1475}{0.1475}\right| \times 100 \% \\
& \approx 1.69 \%
\end{aligned}
$

Question

[Maximum mark: 6]
The number of days rain per month in London varies depending on the time of year. The data shows the number of wet days per month.
$$
\begin{array}{llllllllllll}
17 & 13 & 11 & 14 & 13 & 11 & 13 & 12 & 13 & 14 & 16 & 16
\end{array}
$$

(a) For this data, find
(i) the median;
(ii) the minimum and maximum values.                                                                            [3]

The lower quartile of the data is $12.5$ and the upper quartile of the data is 15 .

(b) Draw a box-and-whisker diagram to represent the data.                                                                            [3]

Answer/Explanation

(a) (i) First, rearrange the data in ascending order:
$\begin{array}{llllllllllll}11 & 11 & 12 & 13 & 13 & 13 & 13 & 14 & 14 & 16 & 16 & 17\end{array}$

The median of a data set is the number in the middle. Since there are 12 numbers in total, the median is the average of the 6 th and 7 th numbers, which are 13 and 13. Hence,
$
\begin{aligned}
{[\text { median }] } & =\frac{13+13}{2} \\
& =13
\end{aligned}
$

(ii) $\operatorname{Min}=11, \operatorname{Max}=17$

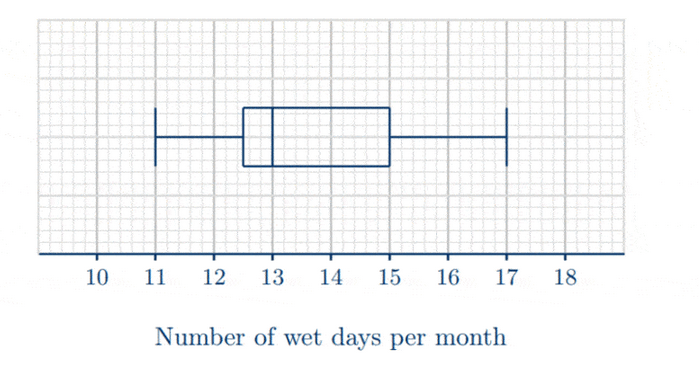
(b) We have the five-number summary of the given data set as follows.

  •  $\operatorname{Min}=11$
  • $Q_1=12.5$
  • Median $=13$
  • $Q_3=15$
  • $\operatorname{Max}=17$

Based off the summary above, we can draw the box-and-whisker diagram as following.

Scroll to Top