Download IITian Academy App for accessing Online Mock Tests and More..

Question
State which of the following sets of data are discrete.
(i) Speeds of cars travelling along a road.
(ii) Numbers of members in families.
(iii) Maximum daily temperatures.
(iv) Heights of people in a class measured to the nearest cm.
(v) Daily intake of protein by members of a sporting team.[2]
The boxplot below shows the statistics for a set of data.
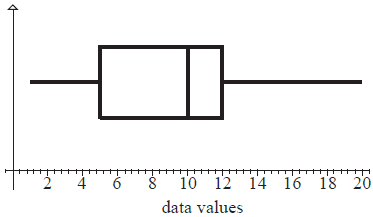
For this data set write down the value of
(i) the median
(ii) the upper quartile
(iii) the minimum value present[3]
Write down three different integers whose mean is 10.[1]
Answer/Explanation
Markscheme
(ii) and (iv) are discrete. (A1)(A1)
Award (A1)(A0) for both correct and one incorrect.
Award (A1)(A0) for one correct and two incorrect.
Otherwise, (A0)(A0). (C2)[2 marks]
(i) Median = 10 (A1)
(ii) Q3 = 12 (A1)
(iii) Min value = 1 (±0.2) (A1) (C3)[3 marks]
Any three different integers whose mean is 10 e.g. 9, 10, 11. (A1) (C1)[1 mark]
Question
There are \(120\) teachers in a school. Their ages are represented by the cumulative frequency graph below.
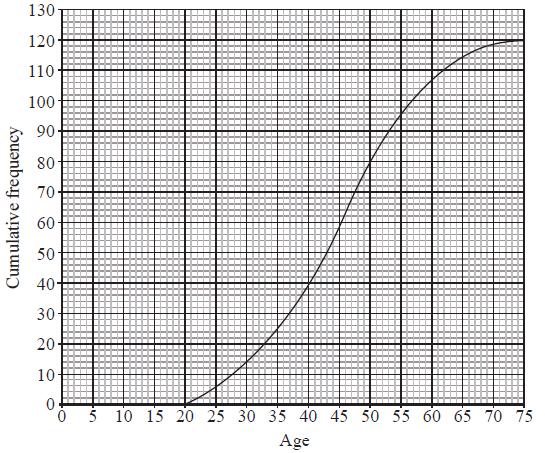
Write down the median age.[1]
Find the interquartile range for the ages.[2]
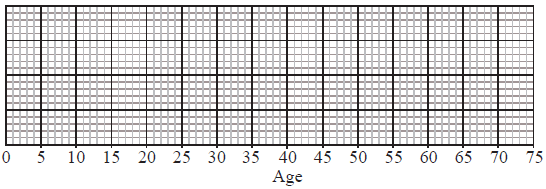
Given that the youngest teacher is \(21\) years old and the oldest is \(72\) years old, represent the information on a box and whisker plot using the scale below.
 [3]
[3]
Answer/Explanation
Markscheme
\({\text{Median }}= 45\) (A1) (C1)
Accept \(45.5\)[1 mark]
\(53 – 37\) for identifying correct quartiles (A1)
\( = 16\) for correct answer to subtraction (A1)(ft) (C2)
(ft) on their quartiles[2 marks]
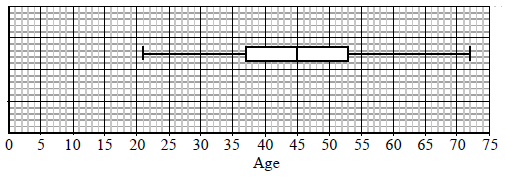
Median marked correctly. (A1)(ft)
Box with ends at candidate’s quartiles. (A1)(ft)
End points at \(21\) and \(72\) joined to box with straight lines. (A1) (C3)
Note: Award (A0) if lines go right through the box.[3 marks]
Question
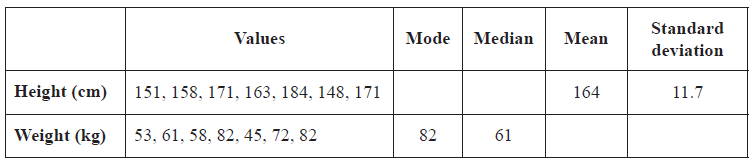
Complete the following table of values for the height and weight of seven students.
Answer/Explanation
Markscheme
\({\text{Mode}} = 171\) (A1)
\({\text{Median }}148{\text{, }}151{\text{, }}158{\text{, }}163{\text{, }}171{\text{, }}171{\text{, }}184\)
\( = 163\) (A1)
\({\text{Mean}} = 64.7\) (A1)
\({\text{Standard deviation}} = 13.3\) (A1) (C4)
Note: If both mean and standard deviation given to 2 significant figures
\({\text{Mean }}65\), (A0)(AP)
\({\text{Standard deviation }}13\) (A1)(ft) ((AP) already deducted).[4 marks]
Question
The following histogram shows the weights of a number of frozen chickens in a supermarket. The weights are grouped such that \(1 \leqslant {\text{weight}} < 2\), \(2 \leqslant {\text{weight}} < 3\) and so on.
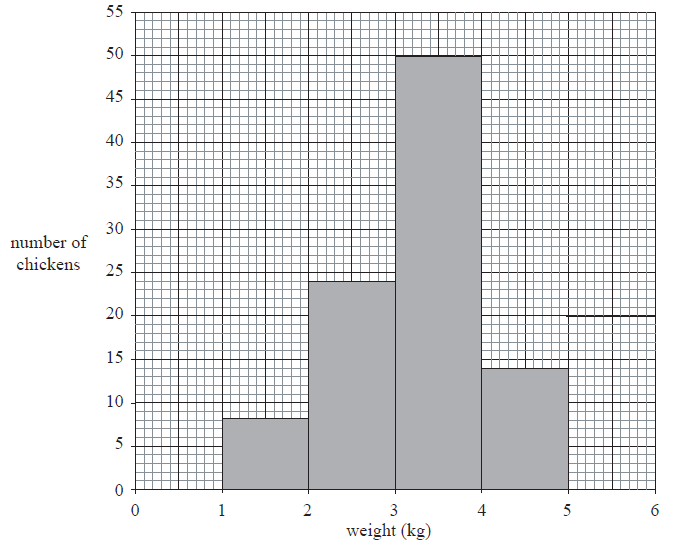
Find the total number of chickens.[1]
Write down the modal group.[1]
Gabriel chooses a chicken at random.
Find the probability that this chicken weighs less than \(4{\text{ kg}}\).[2]
Answer/Explanation
Markscheme
\(96\) (A1) (C1)[1 mark]
\(3 \leqslant {\text{weight}} < 4{\text{ kg}}\) . Accept \(3 – 4{\text{ kg}}\) (A1) (C1)[1 mark]
For adding three heights or subtracting \(14\) from \(96\) (M1)
\(\frac{{82}}{{96}}{\text{ }}(0.854{\text{ or }}\frac{{41}}{{48}}{\text{, }}85.4\% )\) (ft) from (b). (A1)(ft) (C2)[2 marks]
Question
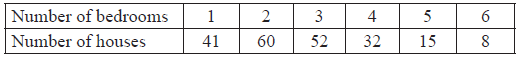
A survey was conducted of the number of bedrooms in \(208\) randomly chosen houses. The results are shown in the following table.
State whether the data is discrete or continuous.[1]
Write down the mean number of bedrooms per house.[2]
Write down the standard deviation of the number of bedrooms per house.[1]
Find how many houses have a number of bedrooms greater than one standard deviation above the mean.[2]
Answer/Explanation
Markscheme
Discrete (A1) (C1)[1 mark]
For attempting to find \(\sum fx/\sum f\) (M1)
\(2.73\) (A1) (C2)
Note: for (b) and (c), if both mean and standard deviation given to 2 significant figures.
Award (C1)(C0)(AP) for \(2.7\). Award (A1)(ft) for \(1.3\) ((AP) already deducted).[2 marks]
\(1.34\) (A1) (C1)
Note: for (b) and (c), if both mean and standard deviation given to 2 significant figures.
Award (C1)(C0)(AP) for \(2.7\). Award (A1)(ft) for \(1.3\) ((AP) already deducted).[1 mark]
Attempt to find their mean \( + \) their standard deviation (can be implied) (M1)
\(23\), (ft) their mean and standard deviation. (A1)(ft) (C2)[2 marks]
Question
The grades obtained by a group of \(20\) IB students are listed below:
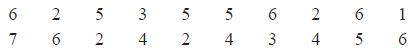
Complete the following table for the grades obtained by the students.
 [2]
[2]
Write down the modal grade obtained by the students.[1]
Calculate the median grade obtained by the students.[2]
One student is chosen at random from the group.
Find the probability that this student obtained either grade \(4\) or grade \(5\).[1]
Answer/Explanation
Markscheme
 (A2) (C2)
Notes: Award (A1) for three correct. Award (A0) for two or fewer correct.[2 marks]
\({\text{Mode}} = 6\) (A1)(ft) (C1)[1 mark]
\({\text{Median}} = 4.5\) (M1)(A1)(ft) (C2)
Note: (M1) for attempt to order raw data (if frequency table not used) or (M1) halfway between 10th and 11th result.[2 marks]
\(\frac{7}{{20}}{\text{ }}(0.35{\text{, }}35\% )\) (A1)(ft) (C1)[1 mark]
Question
The distribution of the weights, correct to the nearest kilogram, of the members of a football club is shown in the following table.

On the grid below draw a histogram to show the above weight distribution.
 [2]
[2]
Write down the mid-interval value for the \(40 – 49\) interval.[1]
Find an estimate of the mean weight of the members of the club.[2]
Write down an estimate of the standard deviation of their weights.[1]
Answer/Explanation
Markscheme
 (A1)(A1) (C2)
Notes: (A1) for all correct heights, (A1) for all correct end points (\(39.5\), \(49.5\) etc.).
Histogram must be drawn with a ruler (straight edge) and endpoints must be clear.
Award (A1) only if both correct histogram and correct frequency polygon drawn. [2 marks]
\(44.5\) (A1) (C1)
Note: If (b) is given as \(45\) then award
(b) \(45\) (A0)
(c) \(58.8{\text{ kg}}\) (M1)(A1)(ft) or (C2)(ft) if no working seen.
(d) \(8.44\) (C1)[1 mark]
Unit penalty (UP) applies in this question.
\({\text{Mean}} = \frac{{44.5 \times 6 + 54.5 \times 18 + \ldots }}{{42}}\) (M1)
Note: (M1) for a sum of frequencies multiplied by midpoint values divided by \(42\).
\( = 58.3{\text{ kg}}\) (A1)(ft) (C2)
Note: Award (A1)(A0)(AP) for \(58\).
Note: If (b) is given as \(45\) then award
(b) \(45\) (A0)
(c) \(58.8{\text{ kg}}\) (M1)(A1)(ft) or (C2)(ft) if no working seen.
(d) \(8.44\) (C1)[2 marks]
\({\text{Standard deviation}} = 8.44\) (A1) (C1)
Note: If (b) is given as \(45\) then award
(b) \(45\) (A0)
(c) \(58.8{\text{ kg}}\) (M1)(A1)(ft) or (C2)(ft) if no working seen.
(d) \(8.44\) (C1)[1 mark]
Question
Eight houses in a street are inhabited by different numbers of people, as shown in the table below.

The following statements refer to the number of inhabitants per house. Write down true (T) or false (F) for each.
The mean is \(5\).[1]
The range is \(4\).[1]
The mode is \(6\).[1]
The standard deviation is \(1.4\) correct to \(2\) significant figures.[1]
Calculate the interquartile range for the number of inhabitants per house.[2]
Answer/Explanation
Markscheme
F (A1)[1 mark]
T (A1)[1 mark]
F (A1)[1 mark]
F (A1) (C4)[1 mark]
IQR = 6 − 4 (M1)
Note: Award (M1) for identifying correct quartiles.
IQR = 2 (A1)(ft) (C2)[2 marks]
Question
The following table shows the number of errors per page in a 100 page document.

State whether the data is discrete, continuous or neither.[1]
Find the mean number of errors per page.[2]
Find the median number of errors per page.[2]
Write down the mode.[1]
Answer/Explanation
Markscheme
Discrete (A1) (C1)[1 mark]
\(\frac{{0 + 24 + 40 + 51 + 44}}{{100}} = \frac{{159}}{{100}} = 1.59\) (M1)(A1) (C2)
Notes: Award (M1) for correctly substituted formula.
Award (M1)(A1) for 1 or 2 if 1.59 is seen.
Award (M0)(A0) for 1 or 2 seen with no working.[2 marks]
1 (M1)(A1) (C2)
Note: Award (M1) for attempt to order raw data (if frequency table not used) or (M1) for indicating halfway between 50th and 51st result or (M1) for 50th percentile seen.[2 marks]
0 (A1) (C1)[1 mark]
Question
The weights, in kg, of 60 adolescent females were collected and are summarized in the box and whisker diagram shown below.

Write down the median weight of the females.[1]
Calculate the range.[2]
Estimate the probability that the weight of a randomly chosen female is more than 50 kg.[1]
Use the box and whisker diagram to determine if the mean weight of the females is less than the median weight. Give a reason for your answer.[2]
Answer/Explanation
Markscheme
42 kg (A1) (C1)
Note: The units are required.
58 − 33 (A1)
Note: Award (A1) for correct maximum and minimum seen.
= 25 (A1) (C2)
\(\frac{1}{4}(0.25,25\% )\) (A1) (C1)
Mean weight is more than the median weight. (A1)
The upper half of the distribution is wider (more dispersed) or data is positively (or right) skewed or equivalent reason. (R1)
OR
\(\left( {{\text{The mean is calculated }}\bar x = \frac{{35.5 \times 15 + 40 \times 15 + 54 \times 15}}{{60}}} \right)\)
\(\bar x = 43.875{\text{ }} (kg)\) (R1) (C2)
Note: Do not award (A1)(R0).
Question
The cumulative frequency graph represents the speed, s, in \({\text{km }}{{\text{h}}^{ – 1}}\), of 80 cars passing a speed camera.
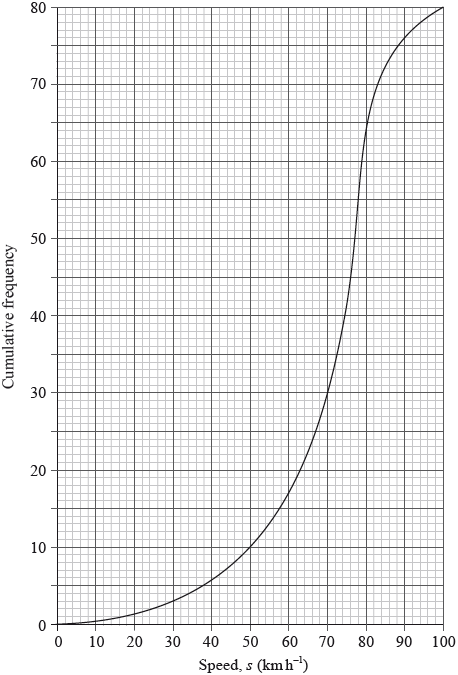
Write down the number of cars passing the camera with speed of less than or equal to 50 \({\text{km}}\,{{\text{h}}^{ – 1}}\).[1]
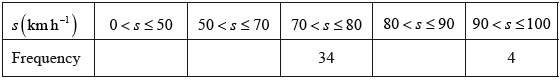
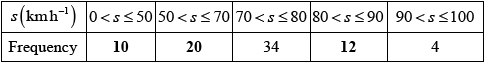
Complete the following grouped frequency table for \(s\), the speed of the cars passing the camera.
 [1]
[1]
Write down the mid-interval value of the \(50 < s \leqslant 70\) interval.[1]
Use your graphic display calculator to find an estimate of
(i) the mean speed of the cars passing the camera;
(ii) the standard deviation of the speed of the cars passing the camera.[3]
Answer/Explanation
Markscheme
10 (A1) (C1)[1 mark]
 (A1)(ft) (C1)
Note: Follow through from their answer to part (a).[1 mark]
60 (A1) (C1)[1 mark]
(i) \(67.5 \left( {{\text{km}}\,{{\text{h}}^{ – 1}}} \right)\) (A2)(ft)
Notes: Award (M1) for an attempt to use the formula for the mean with at least two midpoint values consistent with their answer to part (c). Follow through from their table in part (b).
(ii) \(18.6 (18.6413…)\) (A1)(ft) (C3)
Note: Follow through from their table in part (b).[3 marks]
Question
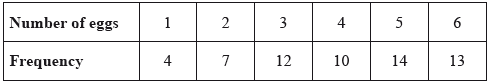
In a particular week, the number of eggs laid by each hen on a farm was counted. The results are summarized in the following table.
State whether these data are discrete or continuous.[1]
Write down
(i) the number of hens on the farm;
(ii) the modal number of eggs laid.[2]
Calculate
(i) the mean number of eggs laid;
(ii) the standard deviation.[3]
Answer/Explanation
Markscheme
discrete (A1) (C1)
(i) 60 (A1)
(ii) 5 (A1) (C2)
(i) \(\frac{{1 \times 4 + 2 \times 7 + 3 \times 12 \ldots }}{{60}}\) (M1)
Notes: Award (M1) for an attempt to substitute into the “mean of a set of data” formula, with at least three correct terms in the numerator.
Denominator must be 60.
Follow through from part (b)(i), only if work is seen.
\( = 4.03{\text{ }}(4.03333 \ldots )\) (A1)
Notes: Award at most (M1)(A0) for an answer of 4 but only if working seen.
(ii) \(1.54{\text{ }}(1.53803 \ldots )\) (A1) (C3)
Question
A group of students were asked how long they spend practising mathematics during the week. The results are shown in the following table.

It is known that \(35 < a < 52\) .
Write down
i) the modal class;
ii) the mid-interval value of the modal class;
iii) the class in which the median lies.[3]
For this group of students, the estimated mean number of hours spent practising mathematics is \(2.69\).
Calculate the value of \(a\) .[3]
Answer/Explanation
Markscheme
i) \(3 \leqslant t < 4\) (A1) (C1)
Note: Accept equivalent notation: \([3,\,\,4)\) or \([3,\,\,4[\).
ii) \(3.5\) (A1)(ft) (C1)
Note: Follow through from part (a)(i).
iii) \(2 \leqslant t < 3\) (A1)(ft) (C1)
Note: Follow through from part (a)(i), for consistent misuse of inequality. Accept equivalent notation: \([2,\,\,3)\) or \([2,\,\,3[\).
\(\frac{{3.5 \times 0.5 + 30 \times 1.5 + a \times 2.5 + 52 \times 3.5 + 43 \times 4.5}}{{35 + 30 + a + 52 + 43}} = 2.69\) (M1)(A1)(ft)
Notes: Award (M1) for substitution into mean formula and equating to \(2.69\), (A1)(ft) for correct substitutions. Follow through from their mid-interval value in part (a)(ii).
\((a = )\,\,40\) (A1)(ft) (C3)
Note: The final (A1)(ft) is awarded only if \(a\) is an integer and \(35 < a < 52\). Follow through from part (a)(ii).
Question
A tetrahedral (four-sided) die has written on it the numbers 1, 2, 3 and 4. The die is rolled many times and the scores are noted. The table below shows the resulting frequency distribution.
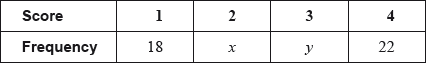
The die was rolled a total of 100 times.
The mean score is 2.71.
Write down an equation, in terms of \(x\) and \(y\), for the total number of times the die was rolled.[1]
Using the mean score, write down a second equation in terms of \(x\) and \(y\).[2]
Find the value of \(x\) and of \(y\).[3]
Answer/Explanation
Markscheme
\(18 + x + y + 22 = 100\) or equivalent (A1) (C1)[1 mark]
\(\frac{{18 + 2x + 3y + 88}}{{100}} = 2.71\) or equivalent (M1)(A1) (C2)
Note: Award (M1) for a sum including \(x\) and \(y\), divided by 100 and equated to 2.71, (A1) for a correct equation.[2 marks]
\(x + y = 60\) and \(2x + 3y = 165\) (M1)
Note: Award (M1) for obtaining a correct linear equation in one variable from their (a) and their (b).
This may be implied if seen in part (a) or part (b).
\(x = 15;{\text{ }}y = 45\) (A1)(ft)(A1)(ft) (C3)
Notes: Follow through from parts (a) and (b), irrespective of working seen provided the answers are positive integers.[3 marks]
Question
A group of 20 students travelled to a gymnastics tournament together. Their ages, in years, are given in the following table.
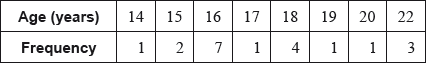
The lower quartile of the ages is 16 and the upper quartile is 18.5.
For the students in this group find the mean age;[2]
For the students in this group write down the median age.[1]
Draw a box-and-whisker diagram, for these students’ ages, on the following grid.
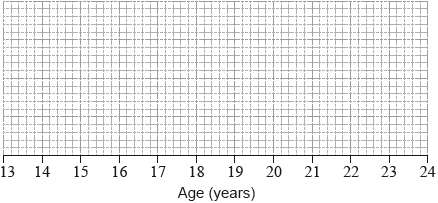 [3]
[3]
Answer/Explanation
Markscheme
\(\frac{{14 + 2 \times 15 + 7 \times 16 + 17 + 4 \times 18 + 19 + 20 + 3 \times 22}}{{20}}\) (M1)
Note: Award (M1) for correct substitutions into mean formula.
\(( = ){\text{ }}17.5\) (A1) (C2)[2 marks]
16.5 (A1) (C1)[1 mark]
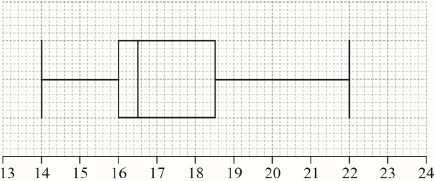 (A1)(A1)(A1)(ft) (C3)
Note: Award (A1) for correct endpoints, (A1) for correct quartiles, (A1)(ft) for their median. Follow through from part (a)(ii), but only if median is between 16 and 18.5. If a horizontal line goes through the box, award at most (A1)(A1)(A0). Award at most (A0)(A1)(A1) if a ruler has not been used.[3 marks]
Question
The histogram shows the time, t, in minutes, that it takes the customers of a restaurant to eat their lunch on one particular day. Each customer took less than 25 minutes.
The histogram is incomplete, and only shows data for 0 ≤ t < 20.

The mean time it took all customers to eat their lunch was estimated to be 12 minutes.
It was found that k customers took between 20 and 25 minutes to eat their lunch.
Write down the mid-interval value for 10 ≤ t < 15.[1]
Write down the total number of customers in terms of k.[1]
Calculate the value of k.[3]
Hence, complete the histogram.[1]
Answer/Explanation
Markscheme
12.5 (A1) (C1)[1 mark]
33 + k OR 10 + 8 + 5 + 10 + k (A1)
Note: Award (A1) for “number of customers = 33 + k”.[1 mark]
\(\frac{{2.5 \times 10 + 7.5 \times 8 + \ldots + 22.5 \times k}}{{33 + k}} = 12\) (M1)(A1)(ft)
Note: Award (M1) for substitution into the mean formula and equating to 12, (A1)(ft) for their correct substitutions.
(k =) 7 (A1)(ft) (C4)
Note: Follow through from part (b)(i) and their mid-interval values, consistent with part (a). Do not award final (A1) if answer is not an integer.[3 marks]
 (A1)(ft) (C1)
Note: Follow through from their part (b)(ii) but only if the value is between 1 and 10, inclusive.[1 mark]