Download IITian Academy App for accessing Online Mock Tests and More..

Question
Tania wishes to see whether there is any correlation between a person’s age and the number of objects on a tray which could be remembered after looking at them for a certain time.
She obtains the following table of results.
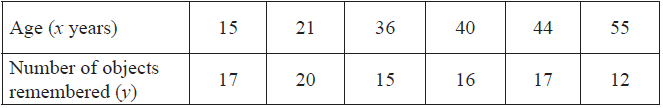
Use your graphic display calculator to find the equation of the regression line of y on x.[2]
Use your equation to estimate the number of objects remembered by a person aged 28 years.[1]
Use your graphic display calculator to find the correlation coefficient r.[1]
Comment on your value for r.[2]
Answer/Explanation
Markscheme
\(a = -0.134, b = 20.9\) (A1)
\(y = 20.9 – 0.134x\) (A1) (C2)[2 marks]
17 objects (A1)(ft)
accept only 17 (C1)[1 mark]
\(r = -0.756\) (A1) (C1)[1 mark]
negative and moderately strong (A1)(ft)(A1)(ft) (C2)[2 marks]
Question
The marks obtained by 8 candidates in Physics and Chemistry tests are given below.
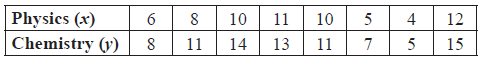
Write down the product moment correlation coefficient, \(r\).[1]
Write down, in the form \(y = mx + c\) , the equation of the regression line \(y\) on \(x\) for the \(8\) candidates.[2]
A ninth candidate obtained a score of \(7\) in the Physics test but was absent for the Chemistry test.
Use your answer to (b) to estimate the score he would have obtained on the Chemistry test.[2]
Give a reason why it is valid to use this regression line to estimate the score on the Chemistry test in part (c).[1]
Answer/Explanation
Markscheme
\(0.965\) (A1) (C1)[1 mark]
\(y = 1.15x + 0.976\) (A1)(A1) (C2)
Note: (A1) for \(1.15x\). (A1) for \( + 0.976\).[2 marks]
\(y = 1.15(7) + 0.976\) (M1)
\({\text{Chemistry}} = 9.03\) (accept \(9\)) (A1)(ft) (C2)
Note: Follow through from candidate’s answer to (b) even if no working is seen. Award (A2)(ft).[2 marks]
the correlation coefficient is close to \(1\)
OR strongly correlated variables
OR \(7\) lies within the range of physics marks. (R1) (C1)[1 mark]
Question
A shop keeper recorded daily sales s of ice cream along with the daily maximum temperature t °C. The results for one week are shown below.

Write down the equation of the regression line for s on t.[3]
Use your equation to predict the ice cream sales on a day when the maximum temperature is 24 °C. Give your answer correct to the nearest whole number.[3]
Answer/Explanation
Markscheme
\(s = 3.56{\text{ }}t – 14.6\) (A1)(A1)(A1) (C3)
Notes: Award (A1) for 3.56.
(A1) for –14.6.
(A1) for s and t.[3 marks]
\(s = 3.56 \times 24 – 14.6\) (M1)
\(= 70.84\) (70.9) (A1)(ft)
= 71 ice creams (A1)(ft) (C3)
Note: (ft) from candidates answer to (a).
Note: The last (A1) is for specified accuracy, (ft) from their answer.
The (AP) for the paper is not applied here.[3 marks]
Question
The scores obtained by five candidates in Mathematics and Physics examinations are given below.
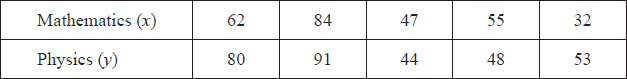
Write down the correlation coefficient, \(r\) , for the examination scores.[2]
Write down the equation of the regression line, \(y\) on \(x\) , for the examination scores of the five candidates.[2]
A sixth candidate scored 72 in the Mathematics examination. Use the regression line, \(y\) on \(x\), to estimate his score on the Physics examination.[2]
Answer/Explanation
Markscheme
\(r = 0.814\) \((0.813745…)\) (A2) (C2)[2 marks]
\(y = 0.888x + 13.5\) \((y = 0.887686 \ldots x + 13.4895 \ldots )\) (A1)(A1)
Note: Award (A1) for \(0.888x\), (A1) for \(13.5\). If the answer is not in the form of an equation award (A1)(A0).
OR
\(y – 63.2 = 0.888(x – 56)\) (A1)(A1) (C2)
Note: Award (A1) for \(0.888\), (A1) for the correct means, \(\bar x\) and \(\bar y\) used.[2 marks]
\(y = 0.887686 \ldots (72) + 13.4895 \ldots \) (M1)
Note: Award (M1) for 72 substituted into their equation of the regression line.
\( = 77\) \((77.4028…)\) (A1)(ft) (C2)
Note: Accept a correct (ft) integer value or a decimal value which would round to the required 3 sf answer (ft). Follow through from their equation in part (b).[2 marks]
Question
The number of calories a person burns during a walk depends on the time they spend walking. The table below shows the number of calories, y, burned by a person in relation to the time they spend walking, x, in minutes.
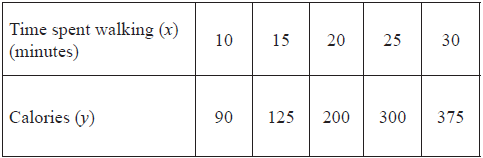
Use your graphic display calculator to write down the equation of the regression line for y on x in the form y = ax + b .[2]
Use your equation to estimate the number of calories that a person will burn during a 17 minute walk.[2]
State whether your answer to part (b) is reliable. Give a reason for your answer.[2]
Answer/Explanation
Markscheme
y = 14.9x – 80 (A1)(A1) (C2)
Notes: Award (A1) for 14.9x and (A1) for –80. Award at most (A0)(A1) if not given in the form of an equation.[2 marks]
14.9 × 17 – 80 (M1)
Note: Award (M1) for substitution in their equation from part (a).
173.3 calories (A1)(ft) (C2)
Note: Accept 173 and 170 even if no working is seen.[2 marks]
Reliable. 17 min is in the range of given values for x or correlation coefficient (r) is 0.989… (A1)(R1) (C2)
Notes: Do not award (A1)(R0). Alternative acceptable reasons using correlation:
Correlation coefficient close to 1
Strong positive correlation
Strong linear correlation
Strong positive association between the variables
Strong relationship between the variables.
Question
Consider the following values of x and y and the scatter diagram which represents the information given in the table.
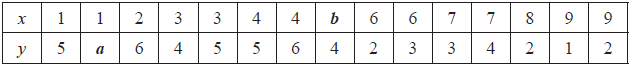
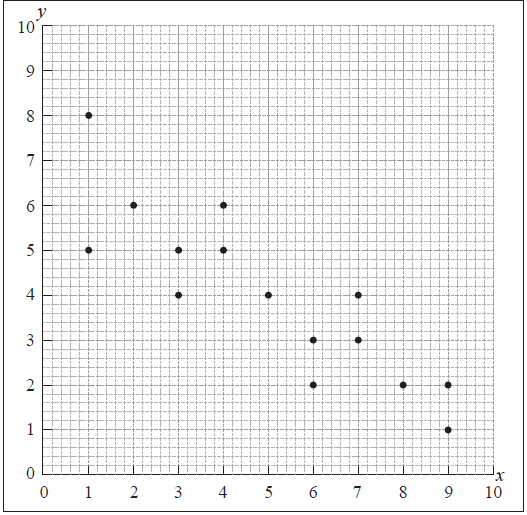
Write down the value of
(i) a ;
(ii) b .[2]
The mean of the x values is 5 and the mean of the y values is 4. Draw the line of best fit on the scatter diagram above.[2]
Use your line of best fit to estimate the value of y when x = 6.5.[2]
Answer/Explanation
Markscheme
a = 8, b = 5 (A1)(A1) (C2)
Note: Award (A0)(A1)(ft) if a = 5, b = 8 .[2 marks]
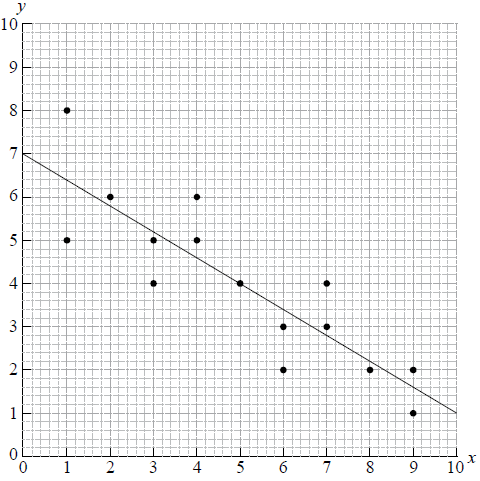 (A1)(A1) (C2)
Note: Award (A1) for straight line passing through (5, 4), (A1) for y-intercept between 6.8 and 8, if necessary with the line extended.[2 marks]
3.1 (±0.3) (M1)(A1)(ft) (C2)
Note: Award (M1) for an indication of use of their line of best fit (dotted lines or some indication of mark in the correct place on graph). Accept y = 3.1 ± 0.3.[2 marks]
Question
A survey investigated the relationship between the number of cleaners, \(n\), and the amount of time, \(t\), it takes them to clean a school.
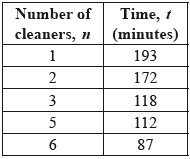
Use your graphic display calculator to write down the equation of the regression line \(t\) on \(n\).[2]
Write down the value of the Pearson’s product–moment correlation coefficient, \(r\).[2]
Use your regression equation to find the amount of time 4 cleaners take to clean the school.[2]
Answer/Explanation
Markscheme
\(t = – 20.1n + 205\)
\(t = (-20.1046 \ldots )n + (204.755 \ldots )\) (A1)(A1) (C2)
Notes: Award (A1) for \(-20.1\) and \(205\) seen,
(A1) for an equation involving \(t\) and \(n\).[2 marks]
\(-0.941 (-0.941366…)\) (A2) (C2)
Notes: Award (A0)(A1) for \( +0.941\).[2 marks]
\(-20.1046 \ldots \times 4 + 204.755 \ldots \) (M1)
Note: Award (M1) for substitution into their regression equation.
\(124\) (minutes) (\(124.337…\)) (A1)(ft) (C2)
Notes: Follow through from their regression equation found in part (a). Accept \(125\) (minutes) (\(124.6\)).[2 marks]
Question
Identical mosquito traps are placed at different distances from a lake. On one day the number of mosquitoes caught in 10 of the traps is recorded.
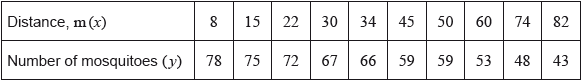
It is believed the number of mosquitoes caught varies linearly with the distance, in metres, of the trap from the lake.
Find
(i) Pearson’s product–moment correlation coefficient, \(r\);
(ii) the equation of the regression line \(y\) on \(x\).[4]
Use the equation of the regression line \(y\) on \(x\) to estimate the number of mosquitoes caught in a trap that is \(28\) m from the lake.[2]
Answer/Explanation
Markscheme
(i) \( – 0.998\;\;\;( – 0.997770 \ldots )\) (A2)
Note: Award (A0)(A1) for \(0.998 (0.997770\ldots )\).
Award (A1)(A0) for \(- 0.997\).
(ii) \(y = – 0.470x + 81.7\;\;\;(y = – 0.469713 \ldots x + 81.7279 \ldots )\) (A1)(A1) (C4)
Note: Award a maximum of (A0)(A1) if the answer is not an equation.
\( – 0.469713 \ldots (28) + 81.7279\) (M1)
Note: Award (M1) for correct substitution of \(28\) into their equation of regression line.
\( = 68.6{\text{ (mosquitoes)}}\;\;\;(68.5759 \ldots )\) (A1)(ft) (C2)
Note: Accept \(68\) or \(69\) or \(68.5(4)\) from use of \(3\) sf values.
Follow through from part (a)(ii).
Question
A survey was carried out to investigate the relationship between a person’s age in years ( \(a\)) and the number of hours they watch television per week (\(h\)). The scatter diagram represents the results of the survey.
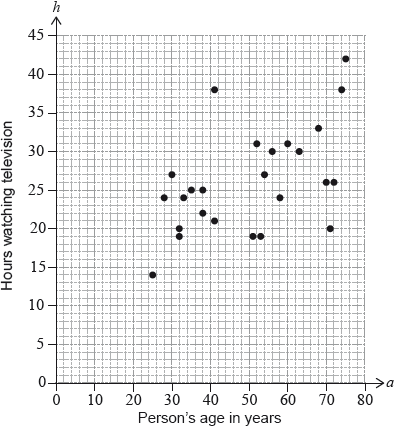
The mean age of the people surveyed was 50.
For these results, the equation of the regression line \(h\) on \(a\) is \(h = 0.22a + 15\).
Find the mean number of hours that the people surveyed watch television per week.[2]
Draw the regression line on the scatter diagram.[2]
By placing a tick (✔) in the correct box, determine which of the following statements is true:
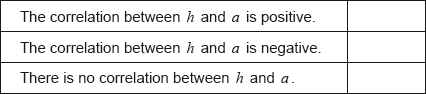 [1]
[1]
Diogo is 18 years old. Give a reason why the regression line should not be used to estimate the number of hours Diogo watches television per week.[1]
Answer/Explanation
Markscheme
\(0.22(50) + 15\) (M1)
Note: Award (M1) for correct substitution of 50 into equation of the regression line.
\(( = ){\text{ }}26\) (A1) (C2)
OR
\(\frac{{655}}{{25}}\) (M1)
Note: Award (M1) for correctly summing the \(h\) values of the points, and dividing by 25.
\(( = ){\text{ }}26.2\) (A1) (C2)[2 marks]
line through \((50,{\text{ }}26 \pm 1)\) and \((0,{\text{ }}15)\) (A1)(ft)(A1) (C2)
Note: Award (A1)(ft) for a straight line through (50, their \(\bar h\)), and (A1) for the line intercepting the \(y\)-axis at \((0,{\text{ }}15)\); this may need to be extrapolated. Follow through from part (a). Award at most (A0)(A1) if the line is not drawn with a ruler.[2 marks]
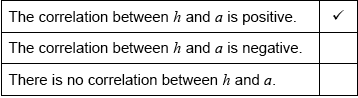 (A1) (C1)
Note: Award (A0) if more than one tick (✔) is seen.[1 mark]
18 is less than the lowest age in the survey OR extrapolation. (A1) (C1)
Note: Accept equivalent statements.[1 mark]
Question
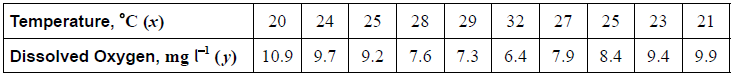
A scientist measures the concentration of dissolved oxygen, in milligrams per litre (y) , in a river. She takes 10 readings at different temperatures, measured in degrees Celsius (x).
The results are shown in the table.
It is believed that the concentration of dissolved oxygen in the river varies linearly with the temperature.
For these data, find Pearson’s product-moment correlation coefficient, r.[2]
For these data, find the equation of the regression line y on x.[2]
Using the equation of the regression line, estimate the concentration of dissolved oxygen in the river when the temperature is 18 °C.[2]
Answer/Explanation
Markscheme
−0.974 (−0.973745…) (A2)
Note: Award (A1) for an answer of 0.974 (minus sign omitted). Award (A1) for an answer of −0.973 (incorrect rounding).[2 marks]
y = −0.365x + 17.9 (y = −0.365032…x + 17.9418…) (A1)(A1) (C4)
Note: Award (A1) for −0.365x, (A1) for 17.9. Award at most (A1)(A0) if not an equation or if the values are reversed (eg y = 17.9x −0.365).[2 marks]
y = −0.365032… × 18 + 17.9418… (M1)
Note: Award (M1) for correctly substituting 18 into their part (a)(ii).
= 11.4 (11.3712…) (A1)(ft) (C2)
Note: Follow through from part (a)(ii).[2 marks]
Question
Consider the following set of data which is plotted on the scatter diagram below.
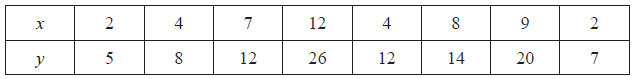
Write down the coordinates of the mean point \((\bar x{\text{, }}\bar y)\).[2]
Write down the value of \(r\), the Pearson’s product-moment correlation coefficient for this set of data.[2]
Draw the regression line for \(y\) on \(x\) on the set of axes above.[2]
Answer/Explanation
Markscheme
\((6{\text{, }}13)\) (A1)(A1) (C2)
\(0.952\) (\(0.95202 \ldots \)) (A2) (C2)
Note: Award (A0) for \(0.9\).
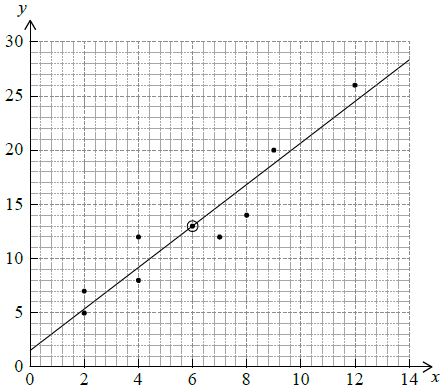
(A1) \(y\) intercept at \(y = 1.8\) (accept between 1 and 2)
(A1)(ft) line passes through their mean point (A1)(A1)(ft) (C2)