Download IITian Academy App for accessing Online Mock Tests and More..

Question
The following diagram is a box and whisker plot for a set of data.
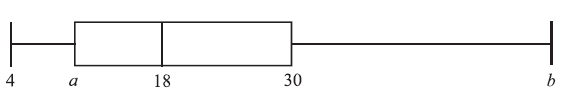
The interquartile range is 20 and the range is 40.
Write down the median value.
[1]
a.
Find the value of
(i) \(a\) ;
(ii) \(b\) .
[4]
b.
Answer/Explanation
Markscheme
18 A1 N1
[1 mark]
a.
(i) 10 A2 N2
(ii) 44 A2 N2
[4 marks]
b.