Download IITian Academy App for accessing Online Mock Tests and More..

Question
The following is a cumulative frequency diagram for the time t, in minutes, taken by 80 students to complete a task.
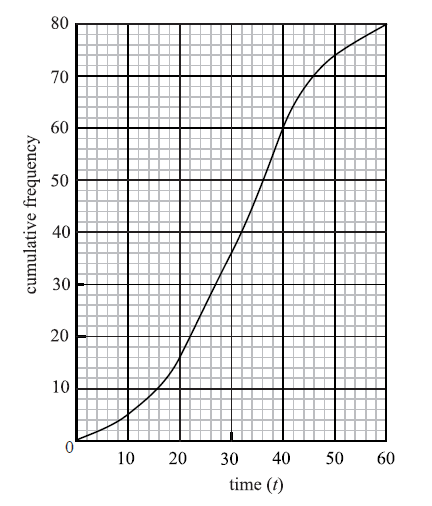
Write down the median.
Find the interquartile range.
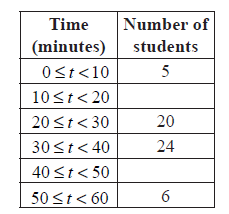
Complete the frequency table below.
Answer/Explanation
Markscheme
median \(m = 32\) A1 N1
[1 mark]
lower quartile \({Q_1} = 22\) , upper quartile \({Q_3} = 40\) (A1)(A1)
\({\text{interquartile range}} = 18\) A1 N3
[3 marks]
 A1A1 N2
[2 marks]
Question
A fisherman catches 200 fish to sell. He measures the lengths, l cm of these fish, and the results are shown in the frequency table below.
Calculate an estimate for the standard deviation of the lengths of the fish.
A cumulative frequency diagram is given below for the lengths of the fish.
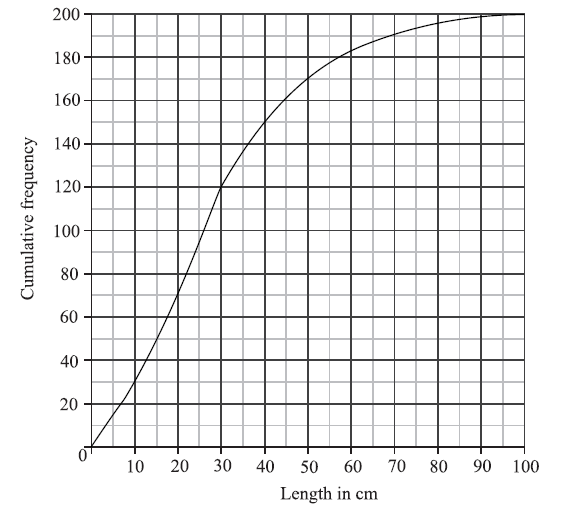
Use the graph to answer the following.
(i) Estimate the interquartile range.
(ii) Given that \(40\% \) of the fish have a length more than \(k{\text{ cm}}\), find the value of k.
In order to sell the fish, the fisherman classifies them as small, medium or large.
Small fish have a length less than \(20{\text{ cm}}\).
Medium fish have a length greater than or equal to \(20{\text{ cm}}\) but less than \(60{\text{ cm}}\).
Large fish have a length greater than or equal to \(60{\text{ cm}}\).
Write down the probability that a fish is small.
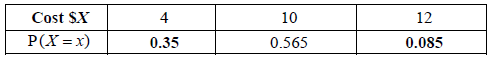
The cost of a small fish is \(\$ 4\), a medium fish \(\$ 10\), and a large fish \(\$ 12\).
Copy and complete the following table, which gives a probability distribution for the cost \(\$ X\) .
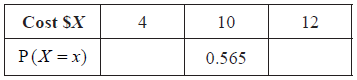
Find \({\text{E}}(X)\) .
Answer/Explanation
Markscheme
evidence of using mid-interval values (5, 15, 25, 35, 50, 67.5, 87.5) (M1)
\(\sigma = 19.8\) (cm) A2 N3
[3 marks]
(i) \({Q_1} = 15\) , \({Q_3} = 40\) (A1)(A1)
\(IQR = 25\) (accept any notation that suggests the interval 15 to 40) A1 N3
(ii) METHOD 1
\(60\% \) have a length less than k (A1)
\(0.6 \times 200 = 120\) (A1)
\(k = 30\) (cm) A1 N2
METHOD 2
\(0.4 \times 200 = 80\) (A1)
\(200 – 80 = 120\) (A1)
\(k = 30\) (cm) A1 N2
[6 marks]
\(l < 20{\text{ cm}} \Rightarrow 70{\text{ fish}}\) (M1)
\({\rm{P(small)}} = \frac{{70}}{{200}}( = 0.35)\) A1 N2
[2 marks]
 A1A1 N2
[2 marks]
correct substitution (of their p values) into formula for \({\text{E}}(X)\) (A1)
e.g. \(4 \times 0.35 + 10 \times 0.565 + 12 \times 0.085\)
\({\text{E}}(X) = 8.07\) (accept \(\$ 8.07\)) A1 N2
[2 marks]
Question
The following frequency distribution of marks has mean 4.5.
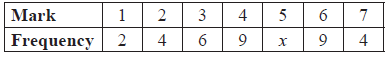
Find the value of x.
Write down the standard deviation.
Answer/Explanation
Markscheme
\(\sum {fx = 1(2) + 2(4) + \ldots + 7(4)} \) , \(\sum {fx = 146 + 5x} \) (seen anywhere) A1
evidence of substituting into mean \(\frac{{\sum {fx} }}{{\sum f }}\) (M1)
correct equation A1
e.g. \(\frac{{146 + 5x}}{{34 + x}} = 4.5\) , \(146 + 5x = 4.5(34 + x)\)
\(x = 14\) A1 N2
[4 marks]
\(\sigma = 1.54\) A2 N2
[2 marks]
Question
The following table gives the examination grades for 120 students.
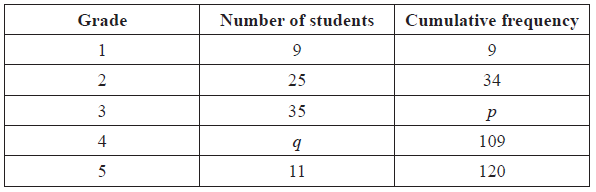
Find the value of
(i) p ;
(ii) q .
Find the mean grade.
Write down the standard deviation.
Answer/Explanation
Markscheme
(a) (i) evidence of appropriate approach (M1)
e.g. \(9 + 25 + 35\) , \(34 + 35\)
\(p = 69\) A1 N2
(ii) evidence of valid approach (M1)
e.g. \(109 – \) their value of p, \(120 – (9 + 25 + 35 + 11)\)
\(q = 40\) A1 N2
[4 marks]
evidence of appropriate approach (M1)
e.g. substituting into \(\frac{{\sum {fx} }}{n}\), division by 120
mean \(= 3.16\) A1 N2
[2 marks]
1.09 A1 N1
[1 mark]
Question
A standard die is rolled 36 times. The results are shown in the following table.
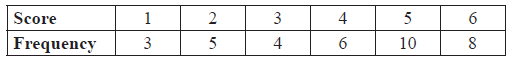
Write down the standard deviation.
Write down the median score.
Find the interquartile range.
Answer/Explanation
Markscheme
\(\sigma = 1.61\) A2 N2
[2 marks]
median \( = 4.5\) A1 N1
[1 mark]
\({Q_1} = 3\) , \({Q_3} = 5\) (may be seen in a box plot) (A1)(A1)
\({\text{IQR}} = 2\) (accept any notation that suggests the interval 3 to 5) A1 N3
[3 marks]
Question
Consider the following cumulative frequency table.
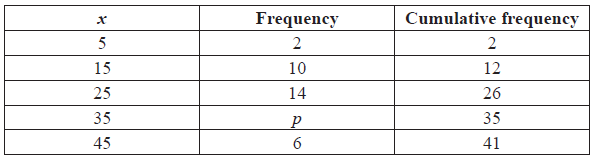
Find the value of \(p\) .
Find
(i) the mean;
(ii) the variance.
Answer/Explanation
Markscheme
valid approach (M1)
eg \(35 – 26\) , \(26 + p = 36\)
\(p = 9\) A1 N2
[2 marks]
(i) mean \( = 26.7\) A2 N2
(ii) recognizing that variance is (sd)2 (M1)
eg \(11.021{ \ldots ^2}\) , \(\sigma = \sqrt {{\mathop{\rm var}} } \) , \(11.158{ \ldots ^2}\)
\({\sigma ^2} = 121\) A1 N2
[4 marks]
Question
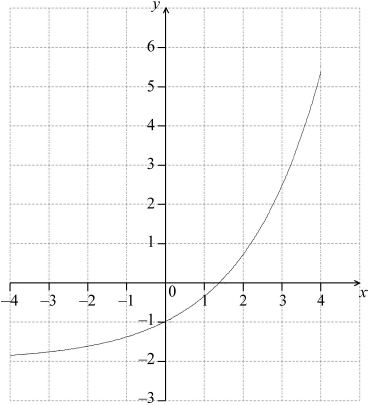
Let \(f(x) = {{\text{e}}^{0.5x}} – 2\).
For the graph of f:
(i) write down the \(y\)-intercept;
(ii) find the \(x\)-intercept;
(iii) write down the equation of the horizontal asymptote.
On the following grid, sketch the graph of \(f\), for \( – 4 \leqslant x \leqslant 4\).
Answer/Explanation
Markscheme
(i) \(y = – 1\) A1 N1
(ii) valid attempt to find \(x\)-intercept (M1)
eg\(\,\,\,\,\,\)\(f(x) = 0\)
1.38629 A1 N2
\(x = 2\ln 2{\text{ (exact), }}1.39\)
(iii) \(y = – 2\) (must be equation) A1 N1
 A1A1A1 N3
[3 marks]
Question
Ten students were surveyed about the number of hours, \(x\), they spent browsing the Internet during week 1 of the school year. The results of the survey are given below.
\[\sum\limits_{i = 1}^{10} {{x_i} = 252,{\text{ }}\sigma = 5{\text{ and median}} = 27.} \]
During week 4, the survey was extended to all 200 students in the school. The results are shown in the cumulative frequency graph:
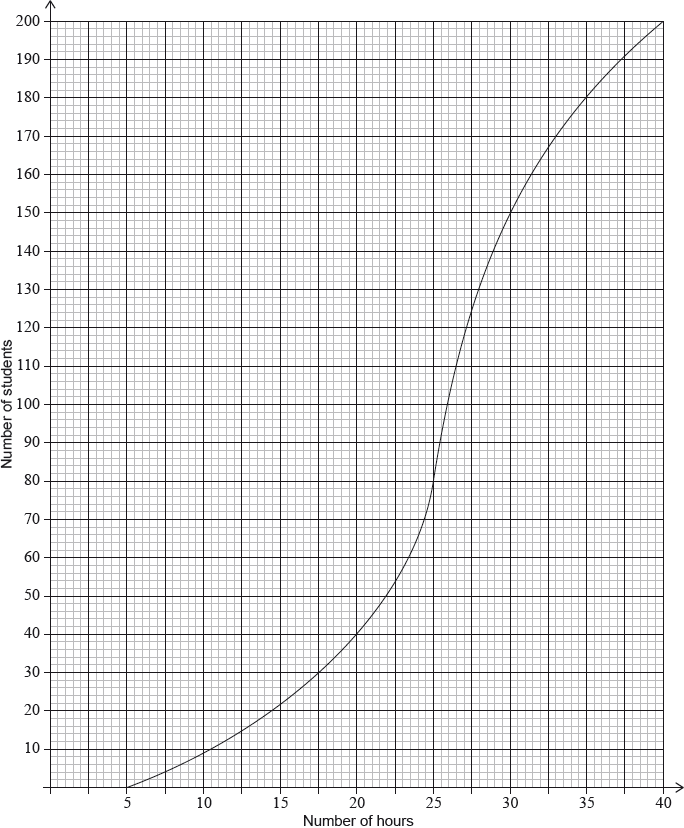
Find the mean number of hours spent browsing the Internet.
During week 2, the students worked on a major project and they each spent an additional five hours browsing the Internet. For week 2, write down
(i) the mean;
(ii) the standard deviation.
During week 3 each student spent 5% less time browsing the Internet than during week 1. For week 3, find
(i) the median;
(ii) the variance.
(i) Find the number of students who spent between 25 and 30 hours browsing the Internet.
(ii) Given that 10% of the students spent more than k hours browsing the Internet, find the maximum value of \(k\).
Answer/Explanation
Markscheme
attempt to substitute into formula for mean (M1)
eg\(\,\,\,\,\,\)\(\frac{{\Sigma x}}{{10}},{\text{ }}\frac{{252}}{n},{\text{ }}\frac{{252}}{{10}}\)
mean \( = 25.2{\text{ (hours)}}\) A1 N2
[2 marks]
(i) mean \( = 30.2{\text{ (hours)}}\) A1 N1
(ii) \(\sigma = 5{\text{ (hours)}}\) A1 N1
[2 marks]
(i) valid approach (M1)
eg\(\,\,\,\,\,\)95%, 5% of 27
correct working (A1)
eg\(\,\,\,\,\,\)\(0.95 \times 27,{\text{ }}27 – (5\% {\text{ of }}27)\)
median \( = 25.65{\text{ (exact), }}25.7{\text{ (hours)}}\) A1 N2
(ii) METHOD 1
variance \( = {({\text{standard deviation}})^2}\) (seen anywhere) (A1)
valid attempt to find new standard deviation (M1)
eg\(\,\,\,\,\,\)\({\sigma _{new}} = 0.95 \times 5,{\text{ }}4.75\)
variance \( = 22.5625{\text{ }}({\text{exact}}),{\text{ }}22.6\) A1 N2
METHOD 2
variance \( = {({\text{standard deviation}})^2}\) (seen anywhere) (A1)
valid attempt to find new variance (M1)
eg\(\,\,\,\,\,\)\({0.95^2}{\text{ }},{\text{ }}0.9025 \times {\sigma ^2}\)
new variance \( = 22.5625{\text{ }}({\text{exact}}),{\text{ }}22.6\) A1 N2
[6 marks]
(i) both correct frequencies (A1)
eg\(\,\,\,\,\,\)80, 150
subtracting their frequencies in either order (M1)
eg\(\,\,\,\,\,\)\(150 – 80,{\text{ }}80 – 150\)
70 (students) A1 N2
(ii) evidence of a valid approach (M1)
eg\(\,\,\,\,\,\)10% of 200, 90%
correct working (A1)
eg\(\,\,\,\,\,\)\(0.90 \times 200,{\text{ }}200 – 20\), 180 students
\(k = 35\) A1 N3
[6 marks]