Download IITian Academy App for accessing Online Mock Tests and More..

Question
The diagram below shows part of the graph of the gradient function, \(y = f'(x)\) .
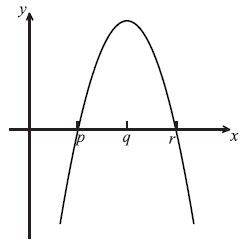
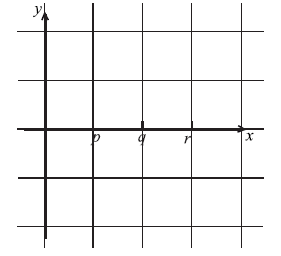
On the grid below, sketch a graph of \(y = f”(x)\) , clearly indicating the x-intercept.
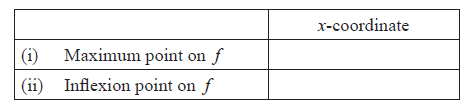
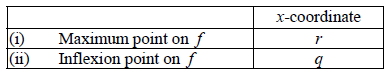
Complete the table, for the graph of \(y = f(x)\) .
Justify your answer to part (b) (ii).
Answer/Explanation
Markscheme
 A1A1 N2
Note: Award A1 for negative gradient throughout, A1 for x-intercept of q. It need not be linear.
[2 marks]
 A1A1 N1N1
METHOD 1
Second derivative is zero, second derivative changes sign. R1R1 N2
METHOD 2
There is a maximum on the graph of the first derivative. R2 N2
Question
The following diagram shows the graph of \(f(x) = {{\rm{e}}^{ – {x^2}}}\) .
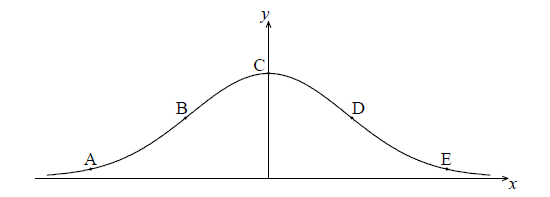
The points A, B, C, D and E lie on the graph of f . Two of these are points of inflexion.
Identify the two points of inflexion.
(i) Find \(f'(x)\) .
(ii) Show that \(f”(x) = (4{x^2} – 2){{\rm{e}}^{ – {x^2}}}\) .
Find the x-coordinate of each point of inflexion.
Use the second derivative to show that one of these points is a point of inflexion.
Answer/Explanation
Markscheme
B, D A1A1 N2
[2 marks]
(i) \(f'(x) = – 2x{{\rm{e}}^{ – {x^2}}}\) A1A1 N2
Note: Award A1 for \({{\rm{e}}^{ – {x^2}}}\) and A1 for \( – 2x\) .
(ii) finding the derivative of \( – 2x\) , i.e. \( – 2\) (A1)
evidence of choosing the product rule (M1)
e.g. \( – 2{{\rm{e}}^{ – {x^2}}}\) \( – 2x \times – 2x{{\rm{e}}^{ – {x^2}}}\)
\( – 2{{\rm{e}}^{ – {x^2}}} + 4{x^2}{{\rm{e}}^{ – {x^2}}}\) A1
\(f”(x) = (4{x^2} – 2){{\rm{e}}^{ – {x^2}}}\) AG N0
[5 marks]
valid reasoning R1
e.g. \(f”(x) = 0\)
attempting to solve the equation (M1)
e.g. \((4{x^2} – 2) = 0\) , sketch of \(f”(x)\)
\(p = 0.707\) \(\left( { = \frac{1}{{\sqrt 2 }}} \right)\) , \(q = – 0.707\) \(\left( { = – \frac{1}{{\sqrt 2 }}} \right)\) A1A1 N3
[4 marks]
evidence of using second derivative to test values on either side of POI M1
e.g. finding values, reference to graph of \(f”\) , sign table
correct working A1A1
e.g. finding any two correct values either side of POI,
checking sign of \(f”\) on either side of POI
reference to sign change of \(f”(x)\) R1 N0
[4 marks]
Question
The following diagram shows the graph of \(f(x) = a\sin bx + c\), for \(0 \leqslant x \leqslant 12\).
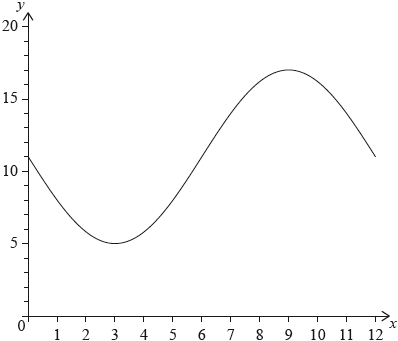
The graph of \(f\) has a minimum point at \((3,{\text{ }}5)\) and a maximum point at \((9,{\text{ }}17)\).
The graph of \(g\) is obtained from the graph of \(f\) by a translation of \(\left( {\begin{array}{*{20}{c}} k \\ 0 \end{array}} \right)\). The maximum point on the graph of \(g\) has coordinates \((11.5,{\text{ }}17)\).
The graph of \(g\) changes from concave-up to concave-down when \(x = w\).
(i) Find the value of \(c\).
(ii) Show that \(b = \frac{\pi }{6}\).
(iii) Find the value of \(a\).
(i) Write down the value of \(k\).
(ii) Find \(g(x)\).
(i) Find \(w\).
(ii) Hence or otherwise, find the maximum positive rate of change of \(g\).
Answer/Explanation
Markscheme
(i) valid approach (M1)
eg\(\,\,\,\,\,\)\(\frac{{5 + 17}}{2}\)
\(c = 11\) A1 N2
(ii) valid approach (M1)
eg\(\,\,\,\,\,\)period is 12, per \( = \frac{{2\pi }}{b},{\text{ }}9 – 3\)
\(b = \frac{{2\pi }}{{12}}\) A1
\(b = \frac{\pi }{6}\) AG N0
(iii) METHOD 1
valid approach (M1)
eg\(\,\,\,\,\,\)\(5 = a\sin \left( {\frac{\pi }{6} \times 3} \right) + 11\), substitution of points
\(a = – 6\) A1 N2
METHOD 2
valid approach (M1)
eg\(\,\,\,\,\,\)\(\frac{{17 – 5}}{2}\), amplitude is 6
\(a = – 6\) A1 N2
[6 marks]
(i) \(k = 2.5\) A1 N1
(ii) \(g(x) = – 6\sin \left( {\frac{\pi }{6}(x – 2.5)} \right) + 11\) A2 N2
[3 marks]
(i) METHOD 1 Using \(g\)
recognizing that a point of inflexion is required M1
eg\(\,\,\,\,\,\)sketch, recognizing change in concavity
evidence of valid approach (M1)
eg\(\,\,\,\,\,\)\(g”(x) = 0\), sketch, coordinates of max/min on \({g’}\)
\(w = 8.5\) (exact) A1 N2
METHOD 2 Using \(f\)
recognizing that a point of inflexion is required M1
eg\(\,\,\,\,\,\)sketch, recognizing change in concavity
evidence of valid approach involving translation (M1)
eg\(\,\,\,\,\,\)\(x = w – k\), sketch, \(6 + 2.5\)
\(w = 8.5\) (exact) A1 N2
(ii) valid approach involving the derivative of \(g\) or \(f\) (seen anywhere) (M1)
eg\(\,\,\,\,\,\)\(g'(w),{\text{ }} – \pi \cos \left( {\frac{\pi }{6}x} \right)\), max on derivative, sketch of derivative
attempt to find max value on derivative M1
eg\(\,\,\,\,\,\)\( – \pi \cos \left( {\frac{\pi }{6}(8.5 – 2.5)} \right),{\text{ }}f'(6)\), dot on max of sketch
3.14159
max rate of change \( = \pi \) (exact), 3.14 A1 N2
[6 marks]
Question
Let \(f(x) = \ln x\) and \(g(x) = 3 + \ln \left( {\frac{x}{2}} \right)\), for \(x > 0\).
The graph of \(g\) can be obtained from the graph of \(f\) by two transformations:
\[\begin{array}{*{20}{l}} {{\text{a horizontal stretch of scale factor }}q{\text{ followed by}}} \\ {{\text{a translation of }}\left( {\begin{array}{*{20}{c}} h \\ k \end{array}} \right).} \end{array}\]
Let \(h(x) = g(x) \times \cos (0.1x)\), for \(0 < x < 4\). The following diagram shows the graph of \(h\) and the line \(y = x\).
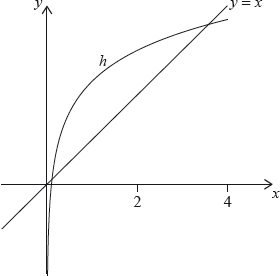
The graph of \(h\) intersects the graph of \({h^{ – 1}}\) at two points. These points have \(x\) coordinates 0.111 and 3.31 correct to three significant figures.
Write down the value of \(q\);
Write down the value of \(h\);
Write down the value of \(k\).
Find \(\int_{0.111}^{3.31} {\left( {h(x) – x} \right){\text{d}}x} \).
Hence, find the area of the region enclosed by the graphs of \(h\) and \({h^{ – 1}}\).
Let \(d\) be the vertical distance from a point on the graph of \(h\) to the line \(y = x\). There is a point \({\text{P}}(a,{\text{ }}b)\) on the graph of \(h\) where \(d\) is a maximum.
Find the coordinates of P, where \(0.111 < a < 3.31\).
Answer/Explanation
Markscheme
\(q = 2\) A1 N1
Note: Accept \(q = 1\), \(h = 0\), and \(k = 3 – \ln (2)\), 2.31 as candidate may have rewritten \(g(x)\) as equal to \(3 + \ln (x) – \ln (2)\).
[1 mark]
\(h = 0\) A1 N1
Note: Accept \(q = 1\), \(h = 0\), and \(k = 3 – \ln (2)\), 2.31 as candidate may have rewritten \(g(x)\) as equal to \(3 + \ln (x) – \ln (2)\).
[1 mark]
\(k = 3\) A1 N1
Note: Accept \(q = 1\), \(h = 0\), and \(k = 3 – \ln (2)\), 2.31 as candidate may have rewritten \(g(x)\) as equal to \(3 + \ln (x) – \ln (2)\).
[1 mark]
2.72409
2.72 A2 N2
[2 marks]
recognizing area between \(y = x\) and \(h\) equals 2.72 (M1)
eg\(\,\,\,\,\,\)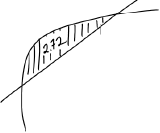
recognizing graphs of \(h\) and \({h^{ – 1}}\) are reflections of each other in \(y = x\) (M1)
eg\(\,\,\,\,\,\)area between \(y = x\) and \(h\) equals between \(y = x\) and \({h^{ – 1}}\)
\(2 \times 2.72\int_{0.111}^{3.31} {\left( {x – {h^{ – 1}}(x)} \right){\text{d}}x = 2.72} \)
5.44819
5.45 A1 N3
[??? marks]
valid attempt to find \(d\) (M1)
eg\(\,\,\,\,\,\)difference in \(y\)-coordinates, \(d = h(x) – x\)
correct expression for \(d\) (A1)
eg\(\,\,\,\,\,\)\(\left( {\ln \frac{1}{2}x + 3} \right)(\cos 0.1x) – x\)
valid approach to find when \(d\) is a maximum (M1)
eg\(\,\,\,\,\,\)max on sketch of \(d\), attempt to solve \(d’ = 0\)
0.973679
\(x = 0.974\) A2 N4
substituting their \(x\) value into \(h(x)\) (M1)
2.26938
\(y = 2.27\) A1 N2
[7 marks]
Question
Let \(f(x) = – 0.5{x^4} + 3{x^2} + 2x\). The following diagram shows part of the graph of \(f\).
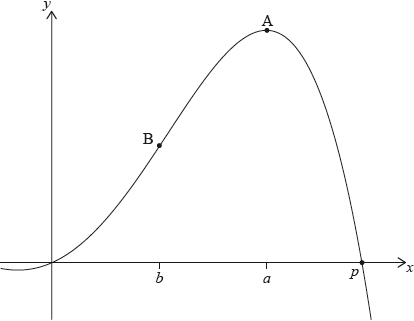
There are \(x\)-intercepts at \(x = 0\) and at \(x = p\). There is a maximum at A where \(x = a\), and a point of inflexion at B where \(x = b\).
Find the value of \(p\).
Write down the coordinates of A.
Write down the rate of change of \(f\) at A.
Find the coordinates of B.
Find the the rate of change of \(f\) at B.
Let \(R\) be the region enclosed by the graph of \(f\) , the \(x\)-axis, the line \(x = b\) and the line \(x = a\). The region \(R\) is rotated 360° about the \(x\)-axis. Find the volume of the solid formed.
Answer/Explanation
Markscheme
evidence of valid approach (M1)
eg\(\,\,\,\,\,\)\(f(x) = 0,{\text{ }}y = 0\)
2.73205
\(p = 2.73\) A1 N2
[2 marks]
1.87938, 8.11721
\((1.88,{\text{ }}8.12)\) A2 N2
[2 marks]
rate of change is 0 (do not accept decimals) A1 N1
[1 marks]
METHOD 1 (using GDC)
valid approach M1
eg\(\,\,\,\,\,\)\(f’’ = 0\), max/min on \(f’,{\text{ }}x = – 1\)
sketch of either \(f’\) or \(f’’\), with max/min or root (respectively) (A1)
\(x = 1\) A1 N1
Substituting their \(x\) value into \(f\) (M1)
eg\(\,\,\,\,\,\)\(f(1)\)
\(y = 4.5\) A1 N1
METHOD 2 (analytical)
\(f’’ = – 6{x^2} + 6\) A1
setting \(f’’ = 0\) (M1)
\(x = 1\) A1 N1
substituting their \(x\) value into \(f\) (M1)
eg\(\,\,\,\,\,\)\(f(1)\)
\(y = 4.5\) A1 N1
[4 marks]
recognizing rate of change is \(f’\) (M1)
eg\(\,\,\,\,\,\)\(y’,{\text{ }}f’(1)\)
rate of change is 6 A1 N2
[3 marks]
attempt to substitute either limits or the function into formula (M1)
involving \({f^2}\) (accept absence of \(\pi \) and/or \({\text{d}}x\))
eg\(\,\,\,\,\,\)\(\pi \int {{{( – 0.5{x^4} + 3{x^2} + 2x)}^2}{\text{d}}x,{\text{ }}\int_1^{1.88} {{f^2}} } \)
128.890
\({\text{volume}} = 129\) A2 N3
[3 marks]
Question
Let \(f\left( x \right) = 12\,\,{\text{cos}}\,x – 5\,\,{\text{sin}}\,x,\,\, – \pi \leqslant x \leqslant 2\pi \), be a periodic function with \(f\left( x \right) = f\left( {x + 2\pi } \right)\)
The following diagram shows the graph of \(f\).

There is a maximum point at A. The minimum value of \(f\) is −13 .
A ball on a spring is attached to a fixed point O. The ball is then pulled down and released, so that it moves back and forth vertically.

The distance, d centimetres, of the centre of the ball from O at time t seconds, is given by
\(d\left( t \right) = f\left( t \right) + 17,\,\,0 \leqslant t \leqslant 5.\)
Find the coordinates of A.
For the graph of \(f\), write down the amplitude.
For the graph of \(f\), write down the period.
Hence, write \(f\left( x \right)\) in the form \(p\,\,{\text{cos}}\,\left( {x + r} \right)\).
Find the maximum speed of the ball.
Find the first time when the ball’s speed is changing at a rate of 2 cm s−2.
Answer/Explanation
Markscheme
−0.394791,13
A(−0.395, 13) A1A1 N2
[2 marks]
13 A1 N1
[1 mark]
\({2\pi }\), 6.28 A1 N1
[1 mark]
valid approach (M1)
eg recognizing that amplitude is p or shift is r
\(f\left( x \right) = 13\,\,{\text{cos}}\,\left( {x + 0.395} \right)\) (accept p = 13, r = 0.395) A1A1 N3
Note: Accept any value of r of the form \(0.395 + 2\pi k,\,\,k \in \mathbb{Z}\)
[3 marks]
recognizing need for d ′(t) (M1)
eg −12 sin(t) − 5 cos(t)
correct approach (accept any variable for t) (A1)
eg −13 sin(t + 0.395), sketch of d′, (1.18, −13), t = 4.32
maximum speed = 13 (cms−1) A1 N2
[3 marks]
recognizing that acceleration is needed (M1)
eg a(t), d ”(t)
correct equation (accept any variable for t) (A1)
eg \(a\left( t \right) = – 2,\,\,\left| {\frac{{\text{d}}}{{{\text{d}}t}}\left( {d’\left( t \right)} \right)} \right| = 2,\,\, – 12\,\,{\text{cos}}\,\left( t \right) + 5\,\,{\text{sin}}\,\left( t \right) = – 2\)
valid attempt to solve their equation (M1)
eg sketch, 1.33
1.02154
1.02 A2 N3
[5 marks]