Question
A teacher wants to determine whether practice sessions improve the ability to memorize digits.
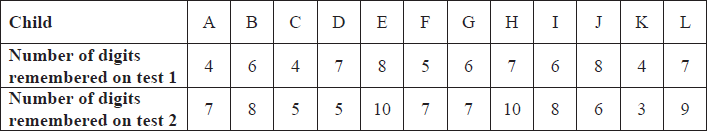
He tests a group of 12 children to discover how many digits of a twelve-digit number could be repeated from memory after hearing them once. He gives them test 1, and following a series of practice sessions, he gives them test 2 one week later. The results are shown in the table below.
(a) State appropriate null and alternative hypotheses.
(b) Test at the 5 % significance level whether or not practice sessions improve ability to memorize digits, justifying your choice of test.
▶️Answer/Explanation
Markscheme
(a) \({{\text{H}}_0}:d = 0;{\text{ }}{{\text{H}}_1}:d > 0\), where d is the difference in the number of digits remembered A1A1
[2 marks]
(b)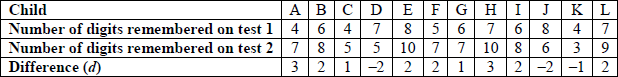 A2
A2
Notes: Award A2 for the correct d values.
Award A1 for one error, A0 for two or more errors.
Use the t-test because the variance is not known M1R1
By GDC
t = 2.106… (A2)
EITHER
p-value = 0.0295 (accept any value that rounds to this number) A2
Since 0.0295 < 0.05 there is evidence that practice sessions improve ability to memorize digits R1
OR
The critical value of t is 1.796 A2
Since 2.106… > 1.796 there is evidence that practice sessions improve ability to memorize digits R1
Note: Award M1R1A1A1R1 for testing equality of means (t = –1.46, p-value = 0.08) .
[9 marks]
Total [11 marks]
Examiners report
Although this question was reasonably well done the hypotheses were often not stated precisely and the fact that the two data sets were dependent escaped many candidates.
Question
The apple trees in a large orchard have, for several years, suffered from a disease for which the outward sign is a red discolouration on some leaves.
The fruit grower knows that the mean number of discoloured leaves per tree is 42.3. The fruit grower suspects that the disease is caused by an infection from a nearby group of cedar trees. He cuts down the cedar trees and, the following year, counts the number of discoloured leaves on a random sample of seven apple trees. The results are given in the table below.

(a) From these data calculate an unbiased estimate of the population variance.
(b) Stating null and alternative hypotheses, carry out an appropriate test at the 10 % level to justify the cutting down of the cedar trees.
▶️Answer/Explanation
Markscheme
(a) \(n = 7,{\text{ sample mean }} = 35\) (A1)
\(s_{n – 1}^2 = \frac{{\sum {{{(x – 35)}^2}} }}{6} = 322\) (M1)A1
[3 marks]
(b) null hypothesis \({{\text{H}}_0}:\mu = 42.3\) A1
alternative hypothesis \({{\text{H}}_1}:\mu < 42.3\) A1
using one-sided t-test
\(\left| {{t_{{\text{calc}}}}} \right| = \sqrt 7 \frac{{42.3 – 35}}{{\sqrt {322} }} = 1.076\) (M1)(A1)
with 6 degrees of freedom , \({t_{{\text{crit}}}} = 1.440 > 1.076\)
\({\text{(or }}p{\text{-value }} = 0.162 > 0.1)\) A1
we conclude that there is no justification for cutting down the cedar trees R1 N0
Note: FT on their t or p-value.
[6 marks]
Total [9 marks]
Examiners report
This question was generally well attempted as an example of the t-test. Very few used the Z statistic, and many found p-values.