Question
The following table gives the average yield of olives per tree, in kg, and the rainfall, in cm, for nine separate regions of Greece. You may assume that these data are a random sample from a bivariate normal distribution, with correlation coefficient \(\rho \).
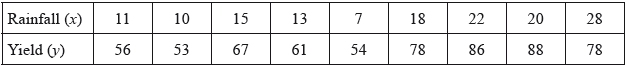
A scientist wishes to use these data to determine whether there is a positive correlation between rainfall and yield.
(a) State suitable hypotheses.
(b) Determine the product moment correlation coefficient for these data.
(c) Determine the associated p-value and comment on this value in the context of the question.
(d) Find the equation of the regression line of y on x.
(e) Hence, estimate the yield per tree in a tenth region where the rainfall was 19 cm.
(f) Determine the angle between the regression line of y on x and that of x on y . Give your answer to the nearest degree.
▶️Answer/Explanation
Markscheme
(a) \({H_0}:\rho = 0\) A1
\({H_1}:\rho > 0\) A1
[2 marks]
(b) 0.853 A2
Note: Accept any answer that rounds to 0.85.
[2 marks]
(c) p-value = 0.00173 (1-tailed) A1
Note: Accept any answer that rounds to 0.0017.
Accept any answer that rounds to 0.0035 obtained from 2-tailed test.
strong evidence to reject the hypothesis that there is no correlation between rainfall and yield or to accept the hypothesis that there is correlation between rainfall and yield R1
Note: Follow through the p-value for the conclusion.
[2 marks]
(d) \(y = 1.78x + 40.5\) A1A1
Note: Accept numerical coefficients that round to 1.8 and 41.
[2 marks]
(e) \(y = 1.77 \ldots (19) + 14.5 \ldots \) M1
74.3 A1
Note: Accept any answer that rounds to 74 or 75.
[2 marks]
(f) the gradient of the regression line y on x is 1.78 or equivalent A1
the regression line of x on y is \(x = 0.409y – 12.2\) (A1)
the gradient of the regression line x on y is \(\frac{1}{{0.409}}{\text{ }}( = 2.44)\) (M1)A1
calculate \(\arctan (2.44) – \arctan (1.78)\) (M1)
angle between regression lines is 7 degrees A1
Note: Accept any answer which rounds to ±7 degrees.
[6 marks]
Total [16 marks]
Examiners report
Question
The students in a class take an examination in Applied Mathematics which consists of two papers. Paper 1 is in Mechanics and Paper 2 is in Statistics. The marks obtained by the students in Paper 1 and Paper 2 are denoted by \((x,{\text{ }}y)\) respectively and you may assume that the values of \((x,{\text{ }}y)\) form a random sample from a bivariate normal distribution with correlation coefficient \(\rho \) . The teacher wishes to determine whether or not there is a positive association between marks in Mechanics and marks in Statistics.
a.State suitable hypotheses.[1]
b.The marks obtained by the 12 students who sat both papers are given in the following table.
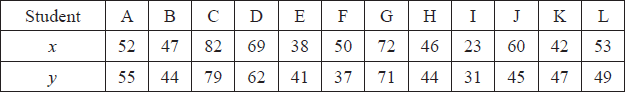
(i) Determine the product moment correlation coefficient for these data and state its p-value.
(ii) Interpret your p-value in the context of the problem.[5]
c.George obtained a mark of 63 on Paper 1 but was unable to sit Paper 2 because of illness. Predict the mark that he would have obtained on Paper 2.[4]
d.Another class of 16 students sat examinations in Physics and Chemistry and the product moment correlation coefficient between the marks in these two subjects was calculated to be 0.524. Using a 1 % significance level, determine whether or not this value suggests a positive association between marks in Physics and marks in Chemistry.[5]
▶️Answer/Explanation
Markscheme
\({{\text{H}}_0}:\rho = 0;{\text{ }}{{\text{H}}_1}:\rho > 0\) A1
[1 mark]
(i) correlation coefficient = 0.905 A2
p-value \( = 2.61 \times {10^{ – 5}}\) A2
(ii) very strong evidence to indicate a positive association between marks in Mechanics and marks in Statistics R1
[5 marks]
the regression line of y on x is \(y = 8.71 + 0.789x\) (M1)A1
George’s estimated mark on Paper 2 \( = 8.71 + 0.789 \times 63\) (M1)
= 58 A1
[4 marks]
\(t = r\sqrt {\frac{{n – 2}}{{1 – {r^2}}}} = 2.3019 \ldots \) M1A1
degrees of freedom = 14 (A1)
p-value \( = 0.0186 \ldots \) A1
at the 1 % significance level, this does not indicate a positive association between the marks in Physics and Chemistry R1
[5 marks]
Examiners report
[N/A]
[N/A]
[N/A]
[N/A]