Question:
Deduce which hormone causes these processes:
a) conversion of glycogen to glucose
▶️Answer/Explanation
Ans: Glucagon.
b) use of glucose rather than fat by body cells to generate energy by respiration.
▶️Answer/Explanation
Ans: Insulin.
Question:
What hormone is secreted by the pancreas after a meal with a high sugar content?
▶️Answer/Explanation
Ans: Insulin.
Question:
Low blood sugar concentrations can cause feelings of hunger.
a) Explain the reasons for hunger at the end of the night.
▶️Answer/Explanation
Ans: Fasting/no food consumed during the night; cell respiration/use of glucose during the night by cells.
b) Explain the reasons for hunger returning more rapidly after a breakfast with a high sugar content than a breakfast with a high protein or fat content.
▶️Answer/Explanation
Ans: Sugary breakfast causes a rapid rise in blood sugar; which causes secretion of insulin; which causes blood sugar to drop; which causes feelings of hunger.
Question:
Blood glucose concentration is sometimes very high at the end of vigorous exercise. Suggest an explanation for this.
▶️Answer/Explanation
Ans: Glucagon is secreted; causing release of glucose by the liver; from breakdown of glycogen/from conversion of amino acids to glycogen; adrenalin is secreted; adrenalin also causes glucose
production from glycogen/from amino acid conversion; glucose released into the blood stream from liver cells.
Experiment
A model cell only needs to have a membrane and cytoplasm for osmosis to occur. The membrane can be made out of the PVC film that is used to seal food items (known as plastic wrap or cling
film). It is about 10 μm thick, whereas a cell membrane is 10 nm thick.
Question:
What is the size ratio between the thickness of a cell membrane and that of the plastic film?
▶️Answer/Explanation
Ans: 10 micrometres/μm to 10 nanometres/nm; 10 micrometres = 10,000 nanometres; ratio is 1,000 to 1.
Question:
If you wanted to make a model of a 20 μm diameter cell, how wide would the model have to be, to give it the same size ratio as you calculated in Question 1?
▶️Answer/Explanation
Ans: 20 micrometres x 1,000 = 20,000 micrometres; = 20 millimetres.
Question:
What is the advantage of making the size ratio for the diameter and the membrane thickness the same?
▶️Answer/Explanation
Ans: Scale model; more realistic; more likely to behave like the thing being modelled.
Question:
Is water added to the plasma or removed from it by each of these processes:
a) sweating,
▶️Answer/Explanation
Ans: Water removed.
b) exhaling,
▶️Answer/Explanation
Ans: Removed.
c) cell respiration,
▶️Answer/Explanation
Ans: Added.
d) secretion of digestive juices such as saliva,
▶️Answer/Explanation
Ans: Removed.
e) absorption of water from food in the intestines,
▶️Answer/Explanation
Ans: Added.
f) urination?
▶️Answer/Explanation
Ans: Removed.
Question:
In Samuel Coleridge Taylor’s poem The Rime of the Ancient Mariner there are these words:

If someone on a boat is dying of thirst and they drink seawater, the osmolarity of their blood plasma becomes higher, not lower. Can you explain this using your understanding of osmosis?
▶️Answer/Explanation
Ans: Seawater has a higher solute concentration than blood plasma/body fluids; therefore seawater in the gut causes water to be removed from the wall of the gut/body tissues by osmosis; so the
concentration of solutes in the plasma is increased.
Question:
Plasma proteins are a major component of the osmolarity of blood plasma. Children who are suffering from severe protein malnutrition develop swollen abdomens due to retention of excessive amounts of water in their tissues. Can you explain this?
▶️Answer/Explanation
Ans: Dissolved proteins in blood plasma help excess water to be drawn out of tissues; by osmosis; so fluid does not accumulate in body tissues; without these plasma proteins the solute concentration of blood plasma is reduced; so excess water remains in the tissues; and they become swollen.
Question:
Approximately 20% of the blood pumped out by the left side of the heart passes to the kidneys. If the cardiac output is 5 liters per minute, what volume of blood is supplied to the kidneys per minute?
▶️Answer/Explanation
Ans: (5 litres/100) x 20 = 1 litre
Question:
Appoximately 10% of the volume of the blood is filtered out as it passes through the glomerular capillaries.
a) What volume of filtrate is produced per minute?
▶️Answer/Explanation
Ans: (1 litre/100) x 10 = 0.1 litre
b) What volume of filtrate is produced per day?
▶️Answer/Explanation
Ans: 0.1 litre x 60 x 24 = 144 litres
Question:
Assuming that a person produces 1.5 liters of urine in a day, what percentage of the volume of filtrate is reabsorbed as it flows through the nephrons?
▶️Answer/Explanation
Ans: (1.5/144) x 100% = 1% not reabsorbed; 100% – 1% = 99% reabsorbed.
Question:
Blood continues to be pumped to the kidneys at night in young children, but in older children and adults the flow is reduced. What is the advantage of this?
▶️Answer/Explanation
Ans: Less urine produced during the night; less need to get up to empty the bladder.
Question:
Explain which type of feedback occurs in these situations:
a) cruise control in a vehicle
▶️Answer/Explanation
Ans: Negative feedback.
b) an exothermic chemical reaction
▶️Answer/Explanation
Ans: Positive feedback.
c) a rock concert when a guitarist gets too close to a loudspeaker
▶️Answer/Explanation
Ans: Positive feedback.
d) the water tank of a toilet with a float valve.
▶️Answer/Explanation
Ans: Negative feedback.
Question:
Viral infections can result in fever, which is a higher than normal body temperature. Discuss whether fever is maintained by positive or negative feedback.
▶️Answer/Explanation
Ans: Negative feedback; but with the set point raised to a higher temperature.
Question:
In the gills, a large surface area of tissue is exposed to the surrounding water. Using the data in the table, deduce whether cells in the gills gain or lose water by osmosis when a salmon is

a) in fresh water
▶️Answer/Explanation
Ans: Gills gain water.
b) in seawater.
▶️Answer/Explanation
Ans: Gills lose water.
Question:
a) Before smoltification, young salmon eat food, but drink little or no water. Despite this, they need to excrete large volumes of dilute urine to keep the solute concentration of their blood plasma in balance. Explain the reasons for this.
▶️Answer/Explanation
Ans: Water absorbed by gills; must be removed to avoid blood becoming hypotonic.
b) Before smoltification Na+ and Cl ions are pumped by active transport from the surrounding water into blood in the gills by protein pumps. Explain the reasons for doing this.
▶️Answer/Explanation
Ans: Some sodium and chloride ions are lost in urine; and must be replaced to avoid body fluids becoming hypotonic.
Question:
a) After smoltification and migration out to sea, salmon drink large quantities of seawater. Explain the reasons for doing this.
▶️Answer/Explanation
Ans: Water lost by gills; must be replaced to avoid blood becoming hypertonic.
b) Drinking large quantities of seawater makes it necessary for salmon to remove large amounts of Na+ and Cl ions from their body every day. Suggest two methods of removal that the salmon could use.
▶️Answer/Explanation
Ans: Active transport from gills to seawater; removal in urine; urine must be hypertonic.
Question:
Summarize the changes that occur in a salmon during the process of smoltification that allow it to adjust from a fresh-water habitat to seawater.
▶️Answer/Explanation
Ans: Increase in drinking rate; decrease in volume of urine produced; increase in salt/solute concentration of urine; pumps for active transport installed in gills; sodium ions pumped from blood
to water in gills; active transport.
Question:
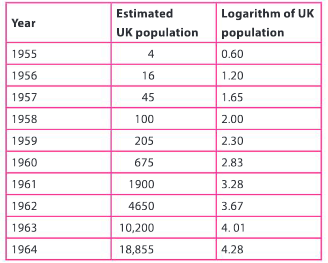
Plot a graph to show the population growth curve of collared doves in Britain from 1955 to 1964.
▶️Answer/Explanation
Ans: Years on the x–axis; UK population on y–axis; points plotted correctly on graph; points joined with a series of ruled lines/a curve passing through all the points.
Question:
a) Geometrical increase is sometimes also called logarithmic or exponential increase. To test whether increase in the collared dove population was exponential, plot a second graph to show
the logarithm of estimated population size for each year from 1955 to 1964.
▶️Answer/Explanation
Ans: Second graph arranged as first one but with log population values on the y–axis.
b) If population increase was genuinely exponential, the points on the graph could be joined with a straight line. Discuss whether the increase in the collared dove population in Britain was exponential.
▶️Answer/Explanation
Ans: Yes – was exponential or very close to exponential; straight line can be drawn passing through/close to all points; perhaps increase is slowing at the end.
Question:
Calculate how many times the British population of collared doves doubled between 1955 and 1964.
▶️Answer/Explanation
Ans: Rose from 4 to 18,855; 4 → 8 → 16 → 32 → 64 → 128 → 256 → 512 → 1024 → 2048 → 4096 → 8192 → 16384; so the population doubled twelve times.
With exponential growth the numbers in a population double in a set period of time. In bacteria, for example, the doubling time can be as short as half an hour. In plants and animals it is much longer. Writing about the human population, Thomas Malthus stated this in his essay: “In the United States of America, where the means of subsistence have been more ample, the manners of the people more pure, and consequently the checks to early marriages fewer than in any of the modern states of Europe, the population has been found to double itself in twenty-five years.”
According to the United States Census Bureau, between 1910 and 2010 the population of the United States of America increased exponentially at an average rate of 1.5% per year. This means that the doubling time of the American population was approximately 50 years—not as fast as Malthus had observed in the 18th century, but still exponential. Even with a shorter doubling time, the US population is rising at an increasing rate—that is the nature of exponential increases.
Question:
If there is no immigration or emigration, reproduction and death are the two processes that can change the size of a population. Deduce which of these combinations will cause exponential
growth in a population.
a) Reproduction rate and death rate are equal.
▶️Answer/Explanation
Ans: No – the population will remain constant.
b) Very high reproduction rate and even higher death rate.
▶️Answer/Explanation
Ans: No – the population will fall.
c) Very low reproduction rate and even lower death rate.
▶️Answer/Explanation
Ans: Yes – the population will rise exponentially.
Question:
Explain the causes of exponential population growth in terms of relative rates of reproduction and death.
▶️Answer/Explanation
Ans: There is exponential growth if the birth rate remains higher than the death rate.
Question:
How can “ample means of subsistence” and “early marriages” make the growth rate of a population faster?
▶️Answer/Explanation
Ans: Ample means of subsistence is a good diet; so the population will be healthy and therefore be able to reproduce; poor diet can reduce the birth rate; early marriage means there can be more years of child–bearing; more children born to each mother; unless contraception/family planning is practiced.
Question:
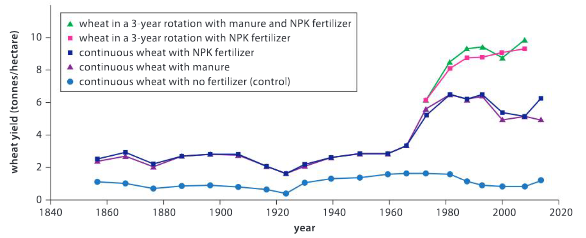
According to the Broadbalk results, which is better for crop yields:
a) growing wheat every year or rotating it with other crops?
▶️Answer/Explanation
Ans: Rotation of wheat with other crops; because yields are higher in the two trials with 3–year rotation.
b) manure or NPK (which is a chemical fertilizer containing those three elements)?
▶️Answer/Explanation
Ans: Little difference; both increase growth by a similar amount above yields with no fertilizer is applied.
Question:
In the 1970s, the type of wheat used in the experiments was changed to a new short-stemmed variety. What were the effects of this on yields?
▶️Answer/Explanation
Ans: Yields increased; as long as fertilizer was applied; yields doubled approximately.
Question:
Yields on the control strip are very low but have not yet dropped to zero. What conclusions do you draw from this?
▶️Answer/Explanation
Ans: There must be sources of nutrient elements other than fertilizers; supply of minerals/P/K from underlying rock; nitrogen from atmospheric deposition.
Question:
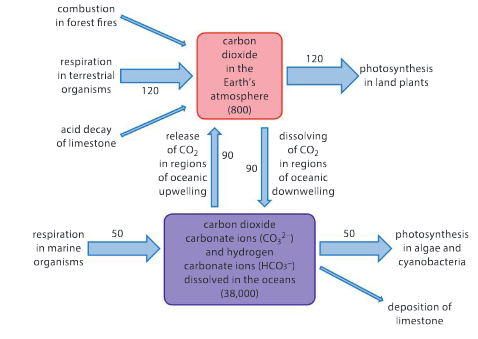
Using the data in the flow chart, explain how the concentration of carbon dioxide in the atmosphere can remain in balance.
▶️Answer/Explanation
Ans: Gains and losses are balanced; respiration = photosynthesis; release from oceans = dissolving in oceans.
Question:
Construct a diagram of the carbon cycle for terrestrial ecosystems such as forests, using the data in the flow chart and the phosphorus cycle diagram (on page 183).
▶️Answer/Explanation
Ans: Cycle diagram should show as a minimum: CO2 in the atmosphere; absorption of CO2 for use in photosynthesis; carbon in the biomass of trees/plants/producers; producer respiration
returning CO2 to the atmosphere; consumers eating producers; carbon in the biomass of consumers; consumer respiration returning CO2 to the atmosphere; death and decomposition of
producers and consumers; carbon in the biomass of decomposers; decomposer respiration returning CO2 to the atmosphere.
Question:
Combustion of fossil fuels, production of cement, and land-use changes currently release approximately nine gigatonnes of carbon dioxide into the atmosphere each year, but the quantity
of carbon dioxide in the atmosphere is increasing by only four gigatonnes per year. Explain this difference.
▶️Answer/Explanation
Ans: Carbon dioxide dissolving in the oceans; making them more acidic.
Question:
There is an estimated 10,000 gigatonnes of carbon in the Earth’s coal, oil and natural gas reserves. Discuss the probable effects of burning all of the fossil fuel reserves and releasing the carbon dioxide into the atmosphere.
▶️Answer/Explanation
Ans: Atmospheric carbon dioxide concentration greatly increased; greatly increased greenhouse effect; climate patterns of the Earth altered significantly; more hurricanes/cyclones/extreme weather events; melting of polar ice/glaciers; sea level rise; coastal flooding; species extinctions; famine/war/large scale migrations of humans.
Balancing photosynthesis and respiration
Carbon dioxide makes water slightly acidic when it dissolves. A narrow-range pH indicator can therefore be used to show whether carbon dioxide concentration has increased or decreased. The indicator usually used is called hydrogen carbonate indicator. The range of colours of this indicator are shown below. Yellow indicates the lowest pH and the highest carbon dioxide concentration. Purple indicates the highest pH and the lowest carbon dioxide concentration.

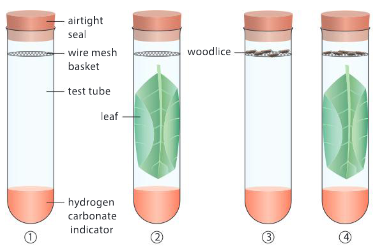
The diagrams below show some possible combinations of plant leaves and animals.
Question:
Explain the reason for all the tubes being the same size and containing the same volume of indicator.
▶️Answer/Explanation
Ans: Control of variables; only the independent variable should affect the results/affect the dependent variable; if the volume inside the tubes/volume of indicator was different then the times taken for colour changes would not be comparable.
Question:
The experiment should be ended as soon as the indicator has changed colour. Explain the reasons for not keeping animals inside the tubes for longer than this.
▶️Answer/Explanation
Ans: Run out of oxygen; cause suffering; possibly cause death of the animals; unethical.
Question:
What is the purpose of the tube without a leaf or animals?
▶️Answer/Explanation
Ans: Control tube; shows that the colour changes of indicator are due to the organisms in the tubes; shows the indicator doesn’t change colour over time by itself.
Question:
Assuming that the indicator starts red, indicating an intermediate pH and carbon dioxide concentration, what colour do you expect the indicator to be in each tube at the end of the experiment?
▶️Answer/Explanation
Ans: Purple in tube 2 due to absorption of carbon dioxide for photosynthesis; yellow in tube 3 due to release of carbon dioxide from respiration; red in tube 4 if photosynthesis and respiration are balanced/orange in tube 4 because the amount of respiration will exceed the amount of photosynthesis.
Question:
What combination of leaves and/or animals would be needed to keep the carbon dioxide concentration inside a tube in balance?
▶️Answer/Explanation
Ans: Only possible to determine this experimentally; enough leaf tissue is needed to absorb carbon dioxide at the same rate as it is emitted from respiration.
Question:
What colour would you expect the indicator to be in the tube with a leaf but no animals, if the tubes was covered with aluminium foil to exclude light?
▶️Answer/Explanation
Ans: Yellow; due to respiration in the leaf tissue in the dark; and no photosynthesis.
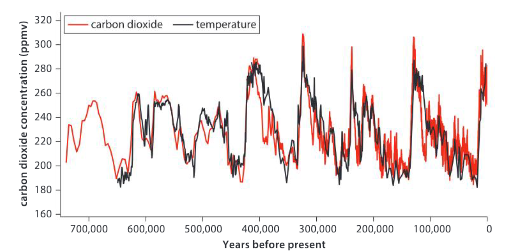
Question:
What were the highest and lowest carbon dioxide concentrations during the past 650,000 years?
▶️Answer/Explanation
Ans: Highest was 310 ppmv (parts per million by volume); lowest was 185 ppmv
Question:
What relationship between carbon dioxide concentration and temperature is shown by the data in the graph?
▶️Answer/Explanation
Ans: Positive correlation; when carbon dioxide concentration rises temperature also rises; correlation is close.
Question:
The difference between the highest and lowest temperatures according to the data on the graph is about 9°C. Calculate how much the temperature increases for each increase of 10 parts per million in carbon dioxide concentration.
▶️Answer/Explanation
Ans: 310 – 185 = 125 ppmv; 9 x 10/125 = 0.72 °C
Question:
a) State the current average carbon dioxide concentration of the atmosphere.
▶️Answer/Explanation
Ans: 400 ppmv
b) Calculate how much higher the current concentration is than the highest concentration found in the ice cores.
▶️Answer/Explanation
Ans: 90 ppmv higher.
c) The carbon dioxide concentration of the atmosphere is currently rising at 2 ppm a year, which is 200 times faster than at the end of the last glaciation. What are the reasons for this?
▶️Answer/Explanation
Ans: Burning of fossil fuels; and (to a lesser extent) deforestation.
d)The concentration of carbon dioxide is now higher than at any time since the Oligocene epoch, 23 million years ago. Should scientists being doing anything about this and if so, what?
▶️Answer/Explanation
Ans: Yes – they should be taking action; informing politicians/the public about the causes and consequences; developing methods of preventing further carbon dioxide concentration increases; doing research to learn more about the causes and consequences.
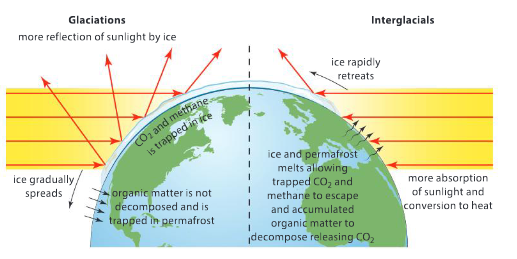
The positive feedback mechanisms that cause warming during interglacials and cooling during glaciations are quite well understood by scientists, but it is less clear what causes the switch
from glaciation to interglacial. The Earth’s path around the Sun changes between an almost circular orbit to an elliptical one (and then back to circular) over the course of 100,000 years.
This change in orbit coincides closely with glacial and interglacial periods, so scientists believe it affects the Earth’s climate.
Question:
How could a change in the Earth’s orbit cause a switch from a glaciation with conditions becoming gradually colder on Earth to an interglacial in which there is rapid warming?
▶️Answer/Explanation
Ans: More heating if more insolation; variation due to cycles in eccentricity, axial tilt and precession; more warming when the northern hemisphere gets more intense insolation.
Question:
Can you find any other theories that might explain this switch?
▶️Answer/Explanation
Ans: An active area of research; difficult to find convincing theories other than Milankovitch cycles/changes in the Earth’s orbit/tilt.
Question:
At times during the Earth’s history, ice sheets extended much further towards the equator than during recent glaciations. They may even have formed a complete cover—this is called Snowball
Earth. What could have caused this and why has it not happened more recently?
▶️Answer/Explanation
Ans: Snowball Earth from 720 million years ago; initial 60 million year period (Sturtian); then another 10 million year period after a gap (Marinoan); Scotland then located on the equator and has rocks from this period showing evidence of glaciation/ice sheet coverage or at least permafrost; positive feedback due to the cooling effect of ice cover; various hypotheses for the trigger that started the snowball Earth periods; high–obliquity/high–tilt hypothesis; zipper–rift hypothesis.
Question:
Use the information in the text to draw two annotated diagrams. One diagram should show the pattern of air and water circulation in the Pacific Ocean in normal conditions and the other when there is an El Niño event.
▶️Answer/Explanation
Ans:
- Diagram of normal conditions should show:
air rising in the western Pacific due to convection; air drawn westwards across the Pacific (trade winds); air falling in the eastern Pacific; eastwards air currents at high altitude; westward water currents near the surface of the Pacific; upwelling of cold water in the eastern Pacific; eastward movement of deeper water; rainfall in the western Pacific. - Diagram of El Nino conditions should show:
air rising in the middle of the Pacific due to convection; air drawn eastwards and westwards across the Pacific; air falling in the western and eastern Pacific; westward and eastward air currents at high altitude; westward and eastward water currents near the surface of the Pacific; weakened upwelling of cold water in the eastern Pacific; rainfall in middle and eastern Pacific; droughts in the western Pacific.
Question:
Draw a diagram or other form of infographic to represent the effects of El Niño on the part of the world where you live.
▶️Answer/Explanation
Ans: Although impacts in some parts of the world are much smaller, they are still real and should be shown with a little text and clear visually appealing diagrams.
Summative assessment: Salmon farming
Toxic “red tides”
Question:
Fish farms along the coast of southern Chile produced nearly 600,000 tonnes of salmon for human consumption in 2015. Young salmon for stocking these farms are reared in tanks at land-
based installations called hatcheries. Adult salmon are needed to produce fertilized eggs and a supply of fresh water is required for filling the tanks. The salmon are reared until they become smolts, which can then be transferred to the salmon farms in the sea. Explain the problems that would develop if salmon younger than smolts were transferred from fresh water to seawater.
▶️Answer/Explanation
Ans: Water lost from gills to seawater; by osmosis; blood solute/sodium ion concentration rises too high; damage to body tissues/dehydration; not yet possible for the salmon to drink seawater and expel the excess ions; pumps for removing sodium ions not yet present in the gills.
Question:
In late 2015 and early 2016 the largest ever “red tides” developed over huge areas off the coast of Chile. They consisted of vast numbers of algae and they spread rapidly. The appearance of large numbers of algae in fresh water or seawater is called an algal bloom. Explain how huge numbers of organisms such as algae can suddenly appear in an ecosystem.
▶️Answer/Explanation
Ans: Eutrophication/enrichment of the water with mineral elements/N/P/fertilizer; growth of algae stimulated; algal numbers not limited by supply of mineral elements; cell division/mitosis; exponential growth of algae; too many algae for primary consumers to eat.
Question:
The algae produced a virulent neurotoxin that killed molluscs and fish and posed a threat to human health if seafood containing it was consumed. An estimated 27 million salmon in salmon farms were killed either by increased water temperatures or by the neurotoxin. Some of these dead salmon were dumped at sea. On one part of the Chilean coast, 40,000 tonnes of sardines were washed up dead and at another site, 337 sei whales (Balaenoptera borealis) were washed up in one of the biggest strandings in history. The red tides coincided with a powerful El Niño event, which warmed water off the Chilean coast by several degrees. Populations of algae are always present in ocean water and for much of the time they stay in balance. Suggest reasons for the populations in the water off the coast of Chile becoming unbalanced.
▶️Answer/Explanation
Ans: Too many salmon farms; salmon feces/uneaten salmon food released into seawater; release of mineral elements/N/P; by decomposition of feces; leaching of mineral elements from agriculture; insufficient regulation of salmon farms by the Chilean authorities.
Question:
Suggest factors that could bring the populations of algae back into balance and, for a time at least, end the red tides.
▶️Answer/Explanation
Ans: Reduce the number of salmon farms; site salmon farms in deeper water where the wastes from them will disperse better; reduce fertilizer use/reduce leaching of mineral elements/N/P from farms; reduce salmon farming during El Nino events.
Modelling algal blooms
Find a pond, lake, river or aquarium in which the numbers of algae are in balance, so the water is clear rather than being bright green or red.
Question:
Formulate a hypothesis for what is preventing the numbers of algae from rising exponentially. Explain the reasons for your hypothesis.
▶️Answer/Explanation
Ans: Award marks for the hypothesis on a scale from 0 marks for no hypothesis or an unreasonable hypothesis or a hypothesis not based on scientific understanding, to 3 marks for a reasonable hypothesis clearly based on scientific understanding, for example shortage of nitrogen and phosphorus limits the numbers of algae.
Question:
Design a scientific experiment to test your hypothesis, including how you will alter the independent variables in your investigation and how you will keep the control variables constant.
▶️Answer/Explanation
Ans: Award marks for the design on a scale from 0 marks for an entirely inadequate design, up to 7 marks for an exemplary design that includes the method of altering the variable cited in the hypothesis together with the number of repeats and the way in which control variables will be kept constant.
Question:
Explain what your dependent variable is, how you will measure it and how you will analyse your results.
▶️Answer/Explanation
Ans: Award marks on a scale from 0 marks for an entirely inadequate answer, up to 5 marks for naming the dependent variable clearly and explaining in full how it will be measured, for example by monitoring how numbers of algae or mass of algae per unit volume changes.
Chilean salmon farming and the ISA virus
Question:
The maps below show the main area of Chilean salmon farms in two periods. Each red spot represents one salmon farm. The fish reared are Atlantic salmon, rather than the native Pacific species.
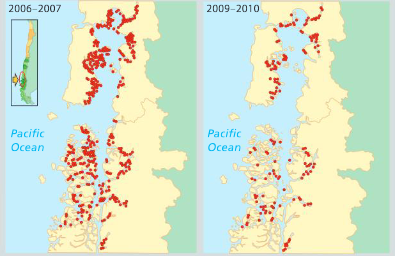
a) Describe the distribution of salmon farms in 2006–2007.
▶️Answer/Explanation
Ans: Dense distribution; in sheltered seawater; close the coast; especially in river mouths/estuaries.
b) Describe the changes in distribution that occurred between 2006–2007 and 2009–2010.
▶️Answer/Explanation
Ans: Reduction; to fewer than half/another quantitative comparison; disappearance of all salmon farms in some areas.
Question:
Infectious salmon anemia (ISA) is a viral disease of Atlantic salmon. The virus infects the red blood cells of the fish and destroys them. The chart above shows the prevalence of ISA on Chilean salmon farms (green line), the number of farms with the disease (blue bars) and the number of operating salmon farms (red bars) over a period from 2007 to 2010. Interpret the data to explain the changes in the number of operating salmon farms.
▶️Answer/Explanation
Ans: Prevalence of ISA rose to 40% of farms in winter 2008–09; ISA on 90 salmon farms; many salmon farms ceased to operate; number of operating farms eventually dropping to 70; negative correlation/as the number/% of ISA infected farms increased the number of operating farms decreased; at the end of the time period the number/% of ISA infected farms was very low and the
number of operating farms was starting to increase.
Question:
Atlantic salmon and both rainbow and brown trout are non- native to Chile, but they have been introduced and there are now populations in the rivers and coastal water. Pacific salmon show strong resistance to the ISA virus. Both species of trout can become infected with the ISA virus but are not killed by it. However, an outbreak of ISA in a Chilean salmon farm often kills close to 100% of the fish.
a) Suggest reasons for far higher mortality due to ISA virus in Chilean salmon farms than in populations of salmon and trout in rivers and the open sea.
▶️Answer/Explanation
Ans: Higher density of salmon; ISA spreads more easily from fish to fish; salmon farms use Atlantic rather than Pacific salmon; Atlantic salmon have lower resistance to ISA.
b) Suggest how ISA could spread from one salmon farm to another.
▶️Answer/Explanation
Ans: Virus could spread in seawater; could spread if infected fish escape; could spread from hatcheries; could spread if infected salmon are transferred from one farm to another; spread easier because salmon farms are close together.
Building a sustainable farming industry
Question:
Consider the statements below together with any other information that you can find on salmon farming in Chile and elsewhere.
▶️Answer/Explanation
Ans: Award marks on a scale from 0 for an essay that is entirely lacking in merit to 15 marks for an exemplary essay that offers a convincing answer to the question.
