Question:
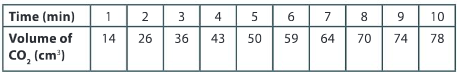
Plot the volume of carbon dioxide gas evolved V(CO2) against time t. You can do this by hand or by using graphing software. Remember that a smooth curve is required to represent the relationship between the data points.
▶️Answer/Explanation
Ans: 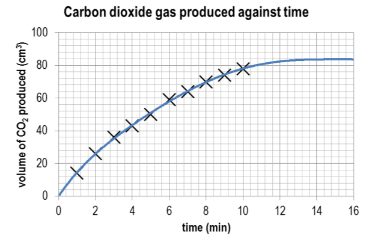
Question:
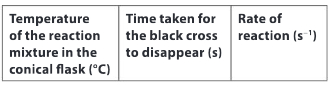
Draw up a data table using the following headings:
▶️Answer/Explanation
Ans: Dependent on the quantitative data collected.
Question:
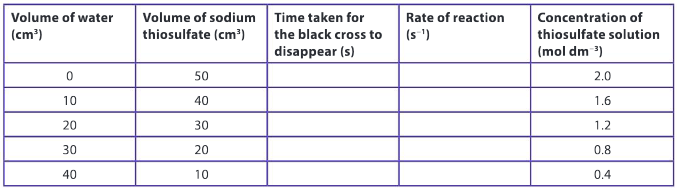
Record your data in a table with the following headings:
▶️Answer/Explanation
Ans: Dependent on the quantitative data collected.
Question:
Record your data in a table with the following headings:
![]()
▶️Answer/Explanation
Ans: Dependent on the quantitative data collected.
Question:
Calculate the percentage increase in each of these gases for the time periods 1980–1989, 1990–1999, 2000–2009 and 2010–2017.
▶️Answer/Explanation
Ans: 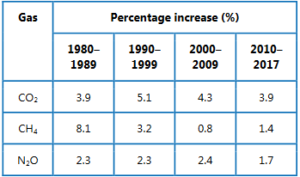
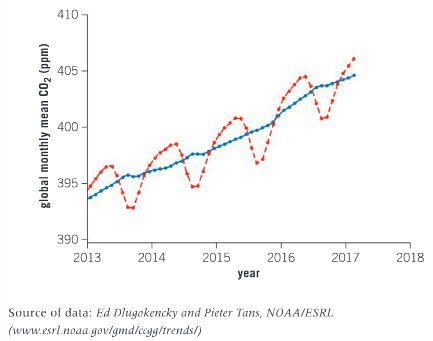
The graph below shows global concentration of carbon dioxide from 2013 to the start of 2017. The dashed red line shows the mean value of carbon dioxide concentration per month. The blue line represents the same, but takes the seasonal cycles of carbon dioxide concentration into account, and is corrected as such.
Question:
Compare the concentration of carbon dioxide in Tasmania and globally over the period 2013–2017. Why are we able to compare this data and make comparisons even though the data originates from different parts of the globe?
▶️Answer/Explanation
Ans: The atmosphere around the globe is not isolated to individual countries. When a country creates a large amount of greenhouse gases, the effects are global as opposed to regional. The fight against increasing greenhouse gas emissions and the accelerated increase in the Earth’s temperature is a global issue.
Question:
The reaction between calcium carbonate, a metal carbonate, and hydrochloric acid, a strong acid, is a vigorous reaction that produces a gas, carbon dioxide.
a) Write an equation for the reaction between calcium carbonate and hydrochloric acid.
▶️Answer/Explanation
Ans: CaCO3(s) + 2HCl(aq) → CaCl2(aq) + CO2(g) + H2O(l)
(reactant formula; product formula; balanced equation)
A series of simple experiments were performed and the data collected was plotted on a graph:
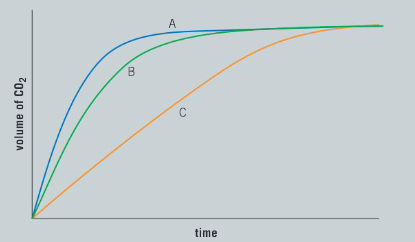
b) The three curves are the result of different concentrations of hydrochloric acid. Which curve represents the highest concentration and which represents the lowest? Justify your answer using scientific reasoning.
▶️Answer/Explanation
Ans: Curve A represents the highest concentration of hydrochloric acid; this curve has the steepest slope over the initial stages of the reaction; Curve C represents the lowest concentration of hydrochloric acid; this curve has the least steep slope over the initial stages of the reaction.
c) All of the curves finish at the same point on the graph. What does this tell us about the reaction?
▶️Answer/Explanation
Ans: All three chemical reactions have the same number of moles of calcium carbonate; the same volume of carbon dioxide is produced in each reaction.
d) Predict the limiting reagent in this reaction.
▶️Answer/Explanation
Ans: Calcium carbonate is the limiting reagent.
Activation energy of a simple chemical reaction
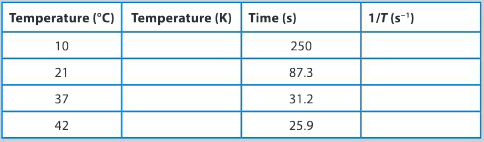
Some students performed the reaction between the thiosulfate ion and hydrogen ions at a range of temperatures. They then recorded their experimental data, using the following table.
Question:
Why it is important that you carefully consider how you will present your quantitative data?
▶️Answer/Explanation
Ans: Quantitative data should be presented in a way that allows the reader to analyze the data and establish if a trend exists; data should be recorded to reflect the level of precision with which it was collected.
Question:
Copy the data table and calculate the temperature in kelvin (K)
▶️Answer/Explanation
Ans: 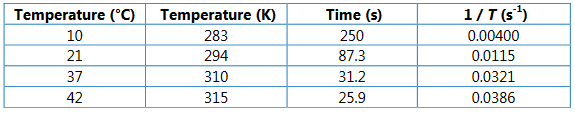
Question:
Construct a temperature (K) versus time (s) graph and draw the appropriate smooth curve.
▶️Answer/Explanation
Ans: 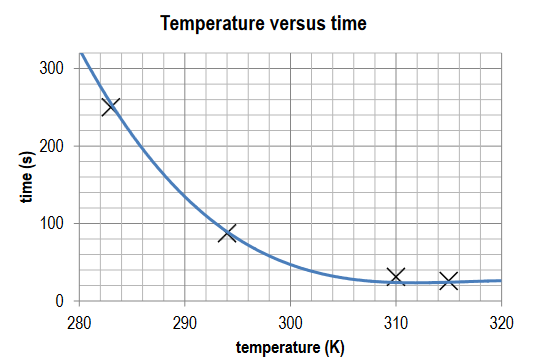
Points plotted accurately; title recorded and axis labelled; smooth curve drawn; anomalous data identified.
Question:
Construct a temperature (K) versus 1/T (s−1) graph. State the relationship illustrated by this form of graph.
▶️Answer/Explanation
Ans: 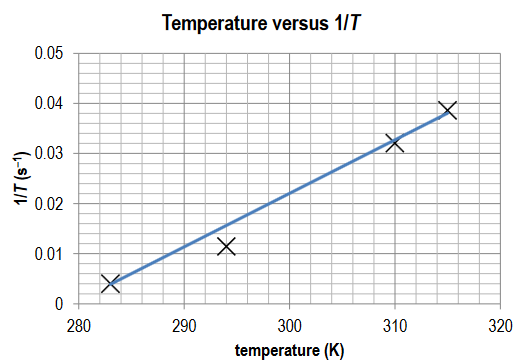
Points plotted accurately; straight line drawn; there is a linear relationship between temperature and 1/T.