IB MYP 4-5 Physics chapter 4 : Movement – Practice Questions

Question 1(8 marks)

The Shinkansen, commonly known as a bullet train, is a network of high-speed magnetic levitation trains in Japan. The Paragraph below explores how the trains were redesigned to minimize the loud booms produced when the trains entered a tunnel.

Japanese bullet trains were first designed in 1964. These trains use magnetic levitation. The repelling force between magnets is used to raise the train above the tracks. This reduces friction and allows the train to travel at very high speeds.
When in a tunnel, the fast speed and the bullet shape caused a layer of air to build up in front of a train. This caused a loud booming sound when the train exited the tunnel.

Scientists noticed that kingfisher birds did not disturb water when they dived into it due to the shape of their beaks. They redesigned the nose of the train by modelling it on a kingfisher’s beak.

The redesigned train cut through the air and reduced the build-up of layers of air in tunnels. This reduced the loud booming sound and increased the train’s efficiency.

Question a (3 marks)

The bullet train was redesigned to improve its performance. This redesign increased the maximum speed.

Select the correct term to complete the sentence. Justify your answer.
The thrust required for the redesigned train to move at a constant speed of $220 \mathrm{~km} \mathrm{~h}^{-1}$ is $\boxed{\rm{Select}}$ by ticking the thrust of the 1964 design.

  • Greater than $()$
  • Less than the $()$
  • Same as $()$

Justification:

▶️Answer/Explanation

Ans:

Select: Less than $(\checkmark)$

Justification: The air resistance (drag force) will decrease and the forces are balanced thus have a contant speed.

Question b (3 marks)

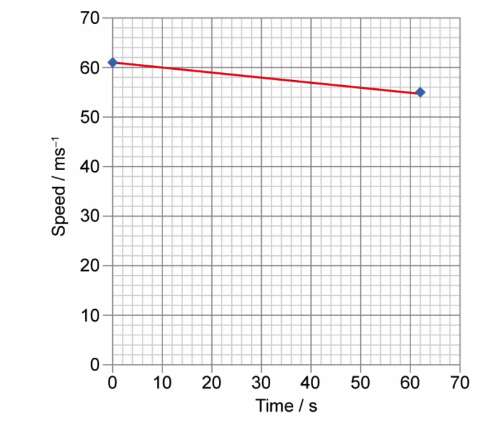
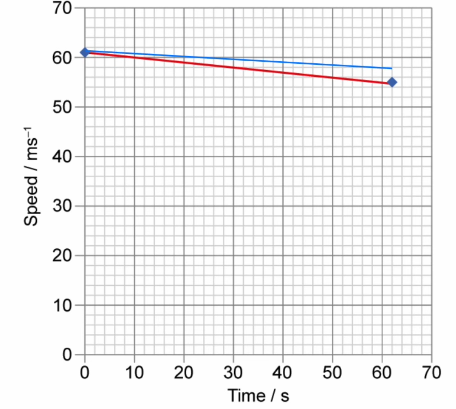
The speed-time graph shows the motion of the 1964 train on its journey through a tunnel. Use the graph to calculate the length of the tunnel.

▶️Answer/Explanation

Ans:

$$\begin{aligned} & \text { Length of the tunnel }=\text { Area under the graph } \\ & \text { Length of the tunnel }=\frac{1}{2}(61+55) \times 62 \\ & \text { Length of the tunnel }=3596 \mathrm{~m} \\ & \text { Length of the tunnel }=3600 \mathrm{~m} (2 s.f) \end{aligned}$$

Question c (2 marks)
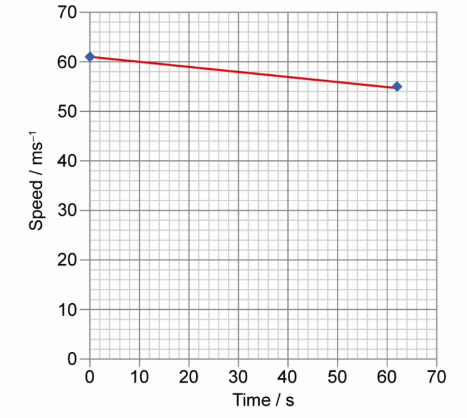
Draw a line on the graph to represent the journey of the redesigned train through the tunnel at the same initial speed.

▶️Answer/Explanation

Ans:

y intercept is the same and always above original line

Question (10 marks)

Some birds migrate every autumn, some fly to cooler countries and some fly to warmer countries. The bar-tailed godwit in the photograph can fly for nearly $11000 \mathrm{~km}$ without stopping. During the eight-day journey that it takes to cover that distance, the bird doesn’t stop for food or rest. This makes the bar-tailed godwit the bird with the longest recorded non-stop flight.

Question a (1 mark)

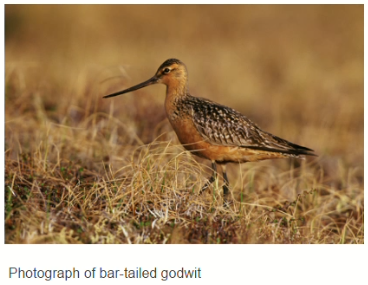
One bar-tailed godwit flies $1200 \mathrm{~km}$ in a day. Calculate the speed in $\mathrm{km} \mathrm{h}^{-1}$ (in kilometres per hour).

▶️Answer/Explanation

Ans:

If the bird flies $1200 \mathrm{~km}$ in a day, we need to determine the number of hours it takes to cover that distance. Let’s denote this time as ‘ $t$ ‘ (in hours).
Therefore, the speed $(v)$ is given by:
$v=\frac{\operatorname{distance}(\mathrm{d})}{\operatorname{time} (\mathrm{t})}$
$1200 \mathrm{~km}=\mathrm{v}\times \mathrm{t}$
To find the speed in $\mathrm{km} / \mathrm{h}$, we need to solve for ‘ $\mathrm{v}$ ‘. Rearranging the equation:
$
v=\frac{1200 \mathrm{~km} }{ \mathrm{t}}
$
Now, we need to know the value of ‘ $t$ ‘ to calculate the speed in $\mathrm{km} / \mathrm{h}$. If we assume the bird flies for 24 hours continuously, the equation becomes:
$
v=\frac{1200 \mathrm{~km} }{ 24 \mathrm{~h}}
$
Simplifying the equation:
$
v=50 \mathrm{~km} / \mathrm{h}
$
Therefore, the speed of the bar-tailed godwit is $50 \mathrm{~km} / \mathrm{h}$.

Question b (2 marks)

Scientists fit satellite transmitters to 16 godwits at two locations in New Zealand. Later the scientists use the information from the satellite transmitters and calculate that the average speed of the bird is $56 \mathrm{~km} \mathrm{~h}^{-1}$.

Outline two factors that may affect the average speed achieved by the bar-tailed godwit.

▶️Answer/Explanation

Ans:

There are several factors that can affect the average speed achieved by bar-tailed godwits during their migration. Here are two key factors:

1. Weather Conditions: Weather conditions play a significant role in the flight speed of bar-tailed godwits. Strong headwinds can slow down their progress, making it more challenging for them to maintain higher speeds. Conversely, favorable tailwinds can provide a boost to their flight speed, allowing them to cover more ground in less time. Variations in wind patterns and speeds along their migration route can greatly influence the average speed of the birds.

2. Individual Fitness and Energy Reserves: The fitness level and energy reserves of individual bar-tailed godwits can impact their average speed. Birds in better physical condition with higher energy reserves will have more stamina and be capable of flying at faster speeds. The amount of fat stores they have accumulated before migration is critical, as it serves as their primary source of energy during the long flight. Birds with greater fat reserves can maintain higher speeds for longer durations.

It’s important to note that these factors can vary significantly between individuals and even across different migration seasons, leading to variations in the average speed of bar-tailed godwits.

Question c (1 marks)

The graph below shows part of a different migrating bird’s journey.

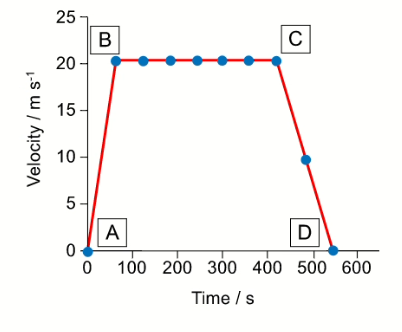
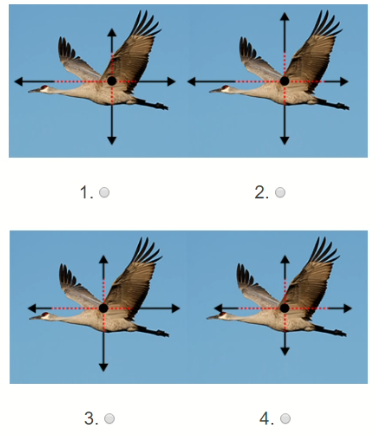
Select the appropriate diagram which represents the forces acting between points $B$ and $C$ on the graph.

▶️Answer/Explanation

Ans:

Question d (4 marks)
The graph below shows part of a different migrating bird’s journey.

Explain what is happening with respect to the force, velocity and acceleration of the bird between points $\rm C$ and $\mathrm{D}$ on the graph. Include in your explanation which of Newton’s laws is being obeyed as the graph changes.

Force…………
Velocity………
Acceleration………..
Newton’s law…………..

▶️Answer/Explanation

Ans:

Question e (2 marks)

Use the graph to calculate the distance travelled by the bird while decelerating.

▶️Answer/Explanation

Ans:

Question (10 marks)

A raindrop falls from a cloud that is $500 \mathrm{~m}$ above the ground.

Question a (3 mark)

Calculate the theoretical maximum velocity of the raindrop before it hits the ground. Assume that the acceleration due to gravity, $g$, is equal to $10 \mathrm{~ms}^{-2}$.

▶️Answer/Explanation

Ans:

To calculate the theoretical maximum velocity of the raindrop before it hits the ground, we can use the equations of motion under constant acceleration. The initial velocity, $u$, of the raindrop is 0 since it starts from rest. The displacement, $s$, is equal to the distance from the cloud to the ground, which is $500 \mathrm{~m}$. The acceleration, $a$, is equal to the acceleration due to gravity, which is $10 \mathrm{~ms}^{-2}$.

We can use the following equation to find the final velocity, $v$, of the raindrop:

\[v^2 = u^2 + 2as\]

Plugging in the values:

\[v^2 = 0 + 2 \cdot 10 \mathrm{~ms}^{-2} \cdot 500 \mathrm{~m}\]
\[v^2 = 10000 \mathrm{~m^2s^{-2}}\]

Taking the square root of both sides to solve for $v$:

\[v = \sqrt{10000} \mathrm{~ms^{-1}}\]
\[v = 100 \mathrm{~ms^{-1}}\]

Therefore, the theoretical maximum velocity of the raindrop before it hits the ground is $100 \mathrm{~ms^{-1}}$.

Question b (1 mark)

A typical raindrop has a mass of $3.0 \times 10^{-5} \mathrm{~kg}$.
State the mass of the raindrop in grams (g).

▶️Answer/Explanation

Ans:

To convert the mass of the raindrop from kilograms to grams, we can multiply the mass by the conversion factor of 1000, since there are 1000 grams in a kilogram.

Given that the mass of the raindrop is $3.0 \times 10^{-5} \mathrm{~kg}$, we can convert it to grams as follows:

$3.0 \times 10^{-5} \mathrm{~kg} \times 1000 \mathrm{~g/kg} = 3.0 \times 10^{-2} \mathrm{~g}$

Therefore, the mass of the raindrop is $3.0 \times 10^{-2} \mathrm{~g}$.

Question c (2 mark)

Use your answers to part (a) and part (d) to calculate the maximum final theoretical momentum of the raindrop. You should include the unit in your answer.

▶️Answer/Explanation

Ans:

To calculate the maximum final theoretical momentum of the raindrop, we need to multiply its maximum theoretical velocity (from part (a)) by its mass in grams (from part (d)).

The maximum final theoretical momentum is given by the equation:

\[p = m \cdot v\]

where \(p\) is momentum, \(m\) is mass, and \(v\) is velocity.

From part (a), we found that the maximum theoretical velocity of the raindrop is \(100 \, \mathrm{m/s}\), and from part (d), we found that the mass of the raindrop is \(3.0 \times 10^{-2} \, \mathrm{g}\).

Converting the mass to kilograms: \(3.0 \times 10^{-2} \, \mathrm{g} = 3.0 \times 10^{-5} \, \mathrm{kg}\)

Now, we can calculate the maximum final theoretical momentum:

\[p = (3.0 \times 10^{-5} \, \mathrm{kg}) \cdot (100 \, \mathrm{m/s})\]
\[p = 3.0 \times 10^{-3} \, \mathrm{kg \cdot m/s}\]

Therefore, the maximum final theoretical momentum of the raindrop is \(3.0 \times 10^{-3} \, \mathrm{kg \cdot m/s}\).

Question d (2 mark)

A student reads that the terminal velocity of a raindrop is determined by its radius.
To determine experimentally if this is true, the student makes the following prediction:
“The terminal velocity of a raindrop is proportional to the radius of the raindrop because the weight will be larger.”

The student measures the terminal velocity of different raindrops and produces the following graph.

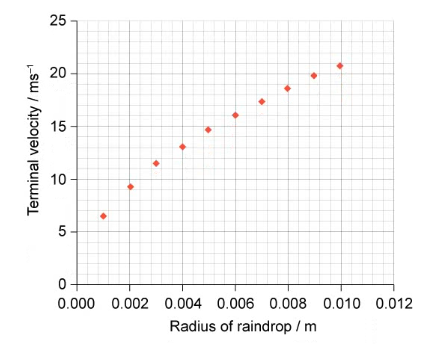
Use the graph to discuss the validity of the hypothesis.

▶️Answer/Explanation

Ans:

Question e (2 mark)

A second student decides to complete a similar investigation to measure the terminal velocity of hailstones. He draws a different graph of the results shown below.

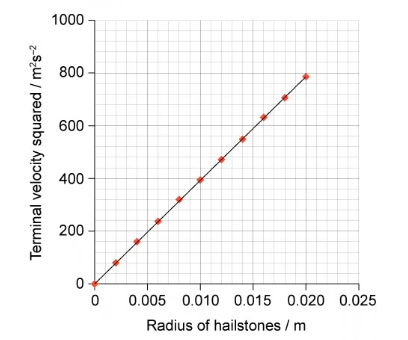
Explain what these results show about the relationship between the radius of hailstones and terminal velocity.

▶️Answer/Explanation

Ans:

Vectors and scalars
A scalar quantity is one which only has a magnitude or size. A vector quantity has a direction associated with it.
Sort the following quantities into scalars and vectors:
ScalarVector
DensityForce
MassMagnetic field
TemperatureMomentum
VolumeWeight

Question:

The Berlin marathon is one of the fastest marathon courses; many world records have been set there. In 2014 Dennis Kimetto ran the 42.195km in 2hours, 2minutes and 57seconds. What was his average speed?

▶️Answer/Explanation

Ans: \(\frac{42.195\times 10^{3}}{2\times 3,600+2\times 60+57}=5.72 ms^{-1}\)

Question:

How fast would he have completed a 100m race if he ran at the same pace?

▶️Answer/Explanation

Ans: \(\frac{100}{5.72}=17.5 s\)

Question:

If Usain Bolt were to be able to maintain his world record 100m pace over a marathon, how long would it take him?

▶️Answer/Explanation

Ans: 100 m in 9.58 s = 10.4 m s–1

\(t = \frac{42,195}{10.4}=4,057 s\)

Question:

The start and finish lines of the Berlin marathon are only 860m apart. By considering this displacement, what was Dennis Kimetto’s average velocity?

▶️Answer/Explanation

Ans: \(t = \frac{860}{2\times 3,600+2\times 60+57}=0.12 ms^{-1}\)

Question:

On Earth, the acceleration of an object in free fall is 9.8ms−2. How fast would an object be traveling after 3s of free fall if it started from rest?

▶️Answer/Explanation

Ans: 9.8 × 3 = 3 × 101 m s–1 (1 s.f.)

Question:

A cheetah can accelerate from rest to 25ms−1 in only 2.5s. What is its acceleration? How does this compare to the acceleration it experiences if it fell out of a tree?

▶️Answer/Explanation

Ans: On ground: \(\frac{25}{2.5}=10 ms^{-2}\)

Out of tree: 9.8 m s–2, so the cheetah is able to accelerate at a similar rate to the acceleration due to gravity.

Question:

On Io (a moon of Jupiter) the acceleration of free fall is 1.8ms−2. After 3s of free fall, how fast would an object be traveling if it started from rest?

▶️Answer/Explanation

Ans: 1.8 × 3 = 5.4 m s–2

Data-based question: Analyzing constant velocity

Question:

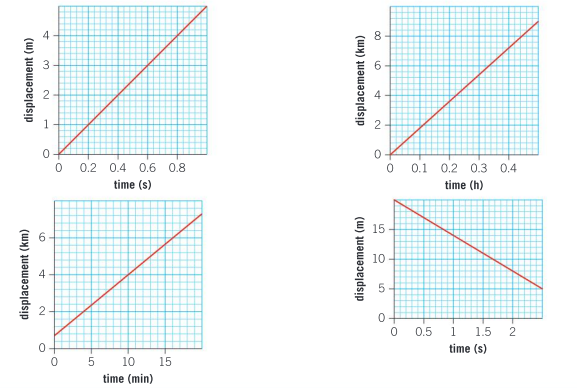
Which of the following displacement–time graphs represents the fastest speed?

▶️Answer/Explanation

Ans: Top left:  \(v = \frac{4}{0.8}=5 ms^{-1}\)

Top right: \(v = \frac{7.2}{0.4}=1.8 km h^{-1} = 5ms^{-1}\)

Bottom left: \(v = \frac{5.6-0.8}{15}=0.32 km min^{-1} = 5.33 ms^{-1}\)

Bottom right: \(v = \frac{20-8}{2}=6 ms^{-1}\)

The graph of the bottom right represents the fastest speed.

Question:

Here is the displacement–time graph for an object in free fall on the surface of Mars.

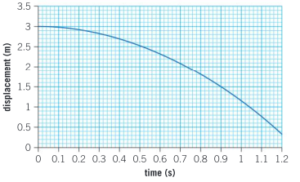
a) How can you tell that the object was dropped from rest?

▶️Answer/Explanation

Ans: The gradient of the graph is initially 0 (i.e. horizontal).

b) What was the average speed over the first 0.9s?

▶️Answer/Explanation

Ans: \(\frac{3.2-1.5}{0.9}=1.7 ms^{-1}\)

c) By drawing a tangent on the graph, estimate the speed of the object after 1s.

▶️Answer/Explanation

Ans: 3.7 m s–1 (allow ±0.2)

d) What is the acceleration of free fall on Mars?

▶️Answer/Explanation

Ans: \(\frac{3.7}{1.0}=3.7 ms^{-2}\)

Question:

The velocity–time graph for a subway train journey between two stops is shown below.

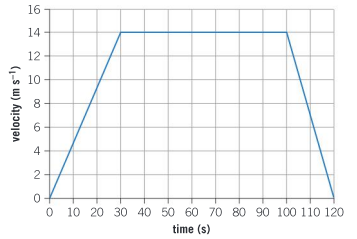
a) What was the maximum velocity of the train?

▶️Answer/Explanation

Ans: 14 m s–1

b) What was the distance between the two stations?

▶️Answer/Explanation

Ans: \(\frac{14\times 30+14\times 20}{2}+14\times 70=1330 m\)

c) Calculate the average speed of the train over the entire journey.

▶️Answer/Explanation

Ans: \(\frac{1330}{120}=11 ms^{-1}\)

d) Determine the initial acceleration of the train.

▶️Answer/Explanation

Ans: \(\frac{14}{30}=0.47 ms^{-2}\)

e) The greater the acceleration or deceleration, the harder it is to stand steady on the train. Explain why you can see from the graph that it is hardest to stand up when the train decelerates coming into the station.

▶️Answer/Explanation

Ans: Acceleration is represented by the gradient of the graph. The gradient is steeper when the train is decelerating so it is harder to stand up at that time.

Question:

Using domain theory explain:

a) what happens if you cut a bar magnet in half

▶️Answer/Explanation

Ans: The domains will remain aligned and you will be left with two magnets.

b) why hitting a magnetized iron rod with a hammer reduces the strength of its magnetic field.

▶️Answer/Explanation

Ans: The originally aligned domains will become misaligned.

c) why heating a magnet sufficiently can reduce its magnetism.

▶️Answer/Explanation

Ans: Heating gives energy to the magnet and causes the domains to become misaligned.

Summative assessment
Bird migration

Question:

During the northern hemisphere’s summer, Arctic terns nest in the most northern parts of the globe, such as Iceland and Greenland, as well as in other parts of northern Europe and Canada. The birds then migrate halfway around the globe to Antarctica, in the southernmost part of the world, in order to find food and to avoid the cold northern hemisphere winter. The Arctic tern has the longest annual migration in the animal kingdom and can cover 90,000 km in one single year.

a) Calculate the tern’s average speed over this time.

▶️Answer/Explanation

Ans: \(\frac{9,0000\times 10^{^{3}}}{365.25\times 24\times 3600}=2.85 ms^{-1}\)

b) The Arctic tern’s migration brings it back to the same nesting grounds each year. Explain why the Arctic tern’s average velocity is zero over this period of time.

▶️Answer/Explanation

Ans: The displacement of the Arctic tern is zero; displacement/velocity is a vector quantity.

c) An Arctic tern can live for 30 years, completing its migration every year. The distance to the Moon is 384,400km. Calculate the distance that an Arctic tern can travel in its lifetime and express your answer in terms of the number of times that it might be able to travel to the Moon and back.

▶️Answer/Explanation

Ans: 90,000 × 30 = 3,600,000 km

\(\frac{3600000}{384400}=9.4 times\)

Question:

A peregrine falcon is the fastest animal in the world. When it dives, it can accelerate to about 40ms−1.

a) Express this speed in kmh−1.

▶️Answer/Explanation

Ans: 40 m s–1 = 40 × 60 × 60 m h–1 = 144 km h–1

b) The bird’s acceleration is about 8ms−2. Calculate the length of time the bird needs to get to its top speed from rest.

▶️Answer/Explanation

Ans: \(\frac{40}{8}=5s\)

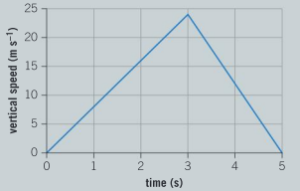
c) A graph of the vertical speed against time for one bird’s dive is shown below. Calculate the distance the bird falls through during its dive.

▶️Answer/Explanation

Ans: \(\frac{3\times 24+2\times 24}{2}=60 m\)

Snail racing

Question:

In snail racing, snails start at the center of a circle and the first snail to reach the outside of the circle wins. Usually, the ground is made wet so that the snails will want to move across it. Some snail racers think that a sugary solution or diluted beer makes the snails travel faster. A student decides to design an experiment to test these ideas.

a) Formulate a hypothesis for this investigation.

▶️Answer/Explanation

Ans: Award marks for a hypothesis which links the independent and dependent variable. For example, as the concentration of the solution given to the snails increases, the speed of the snails will increase.

b) What should the student’s independent variable be?

▶️Answer/Explanation

Ans: The liquid placed on the surface (i.e. water/sugar solution/dilute beer). Also allow concentration of sugar solution/beer.

c) Explain what the dependent variable is. How might it be measured?

▶️Answer/Explanation

Ans: The speed of the snails. This could be measured by measuring the distance travelled by the snails with a ruler. This quantity would then be divided by the time taken for the snails to travel this distance. Time could be measured with a stopwatch or light gates

d) Suggest two suitable control variables for this experiment and explain how they could be kept constant.

▶️Answer/Explanation

Ans: Award one mark for each control variable and one for how to keep it constant. Examples of control variables:

  • Same amount of solution (this might mean that plain water is used as the comparison);
  • Snails crawl over the same surface;
  • Snails travel the same distance;
  • The same type of solution should be used each time (i.e. either only sugar solution should be used or dilute beer);
  • The same snails should be used for each concentration of solution. This could be kept the same by carrying out the experiment over a number of days so that the snails are only affected by one solution at a time;
  • The snails used should all be the same species/around the same mass; this could be achieved by using an electronic balance to measure the mass of the snails.

e) Formulate a hypothesis for this investigation.

▶️Answer/Explanation

Ans: Award marks for a hypothesis which links the independent and dependent variable. For example, as the concentration of the solution given to the snails increases, the speed of the snails will increase.

f) Explain what kind of graph the student should use to present the data.

▶️Answer/Explanation

Ans: If the experiment (see question 3 part (b)) is investigating the relative effects of water, dilute beer and sugar solution, a bar chart should be used. If the experiment is investigating concentration as the independent variable, then a scatter graph is appropriate.

Measuring a horse’s gallop

Question:

A horse rider wants to find out how fast his horse can gallop. He sets out wooden posts every 20m and gallops the horse past the posts. When he passes a post, a friend uses a stopwatch to measure the time taken. The table of his data is shown below.

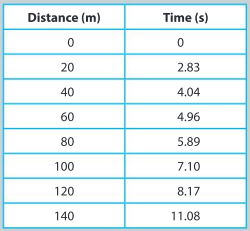
a) Plot a graph of the data. Plot time on the x-axis.

▶️Answer/Explanation

Ans:

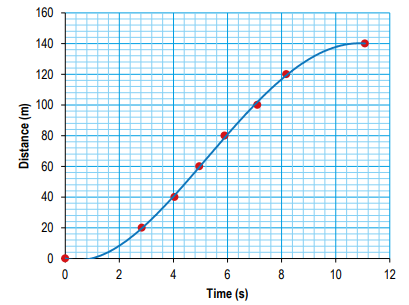
b) Using the data, determine the average speed over the first 20 m.

▶️Answer/Explanation

Ans: \(\frac{20}{2.83}=7.1 ms^{-1}\)

c) Using your graph, determine the maximum speed of the horse from this graph.

▶️Answer/Explanation

Ans: Highest gradient (taken between 3 and 8 seconds): 19 m s–1

d) Comment on the reliability of this data.

▶️Answer/Explanation

Ans:

  • Not very reliable as only one set of data has been taken;
  • As only one person is timing the horse, there could be random errors in the data;
  • Take repeats to improve the reliability.

e) Suggest two improvements that the rider could make to this experiment in order to obtain a more reliable answer.

▶️Answer/Explanation

Ans: Allow any sensible suggestion that would improve the experiment:

  • The experiment could be repeated so that an average for each distance could be taken;
  • Other method of measuring the speed. For example, light gates/film the horse for analysis.

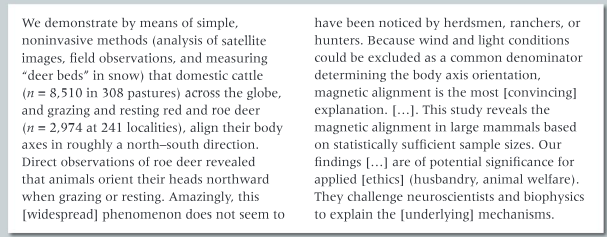
Sensing magnetic fields

Scientists think that some animals are able to help themselves navigate by detecting the Earth’s magnetic field. However, they are not certain about how animals are able to detect magnetic fields. In 2008, some Czech scientists analyzed images from Google Earth and found that cows and deer seemed to prefer to align themselves with the Earth’s magnetic field.
The following text is from the introduction to a paper published in the Proceedings of the National Academy of Sciences of the United States of America, volume 105 on 9 September 2008. The paper was written by Sabine Begall, Jaroslav Cˇ ervený, Julia Neef, Oldrˇich Vojteˇch and Hynek Burda.

Question:

Write a bibliography reference for this paper.

▶️Answer/Explanation

Ans: Begall, S., Červený, J., Neef, J., Vojtěch, O. and Burda, H. 9 September 2008. Proceedings of the National Academy of Sciences of the United States of America, 105.

Question:

Discuss why non-invasive techniques are preferable when studying animal behavior.

▶️Answer/Explanation

Ans: Three from:

  • To avoid harming/distressing the animals;
  • To avoid interfering with their natural behaviours;
  • This might invalidate the study;
  • Appreciation that non-invasive techniques are sometimes more difficult to use.

Question:

Imagine that you are one of the scientists involved in this research. Write a report suggesting why you should be given more funding to continue this research. Explain the potential benefits of understanding why cows and deer prefer to align themselves to the Earth’s magnetic field.

▶️Answer/Explanation

Ans: Award marks on a scale from 0 (no answer) to 5 (good argument explaining benefit of understanding). Potential reasons might include possible medical benefits from better understanding of senses and better farming practices in keeping cows.

Question:

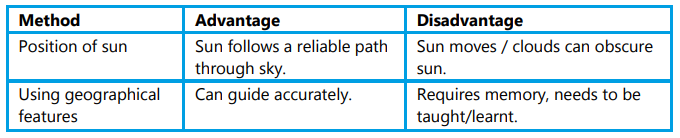
It is believed that some animals use magnetic fields to navigate while migrating. Suggest one other way that animals might navigate, and compare the advantages and disadvantages of this with sensing the Earth’s magnetic field.

▶️Answer/Explanation

Ans: One mark for a suggestion, one each for an advantage/disadvantage. Suggestions:

Question:

It is clear that migrating must take a lot of energy so animals would not do this if they did not have to. Give three motivations for animal migration.

▶️Answer/Explanation

Ans: Climate/weather patterns; food; breeding.

Scroll to Top