Determining Reaction Order from Graphs of Concentration vs. Time
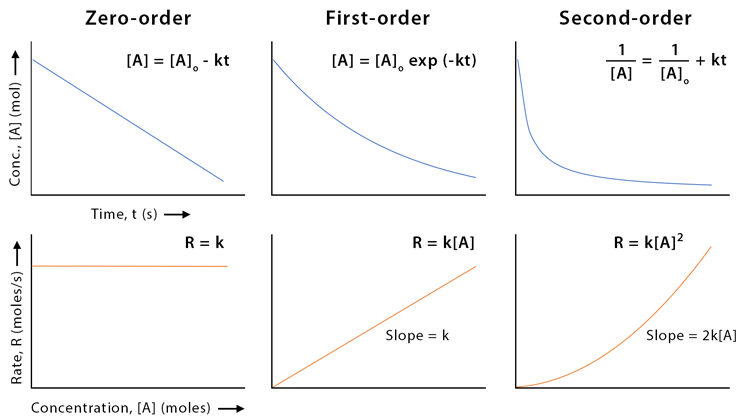
The order of a chemical reaction can be inferred by examining how the concentration of a reactant changes with time. When the concentration data are plotted in different forms, the graph that gives a straight line identifies the reaction order.
| Reaction Order | Plot for Linearity | Slope | Intercept | Interpretation |
|---|---|---|---|---|
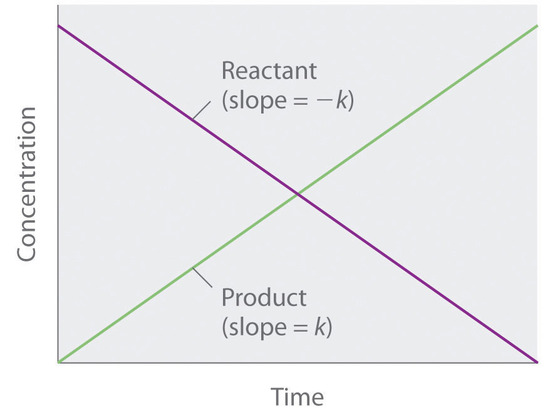
| Zero order | \( \mathrm{[A]} \) vs. \( \mathrm{t} \) | \( \mathrm{-k} \) | \( \mathrm{[A]_0} \) | Straight line indicates constant rate independent of [A] |
| First order | \( \mathrm{\ln[A]} \) vs. \( \mathrm{t} \) | \( \mathrm{-k} \) | \( \mathrm{\ln[A]_0} \) | Straight line indicates rate proportional to [A] |
| Second order | \( \mathrm{\dfrac{1}{[A]}} \) vs. \( \mathrm{t} \) | \( \mathrm{+k} \) | \( \mathrm{\dfrac{1}{[A]_0}} \) | Straight line indicates rate proportional to [A]² |
The reaction order is determined by finding which transformation of concentration data (\( \mathrm{[A]} \), \( \mathrm{\ln[A]} \), or \( \mathrm{1/[A]} \)) yields a linear relationship with time.
Example
A reaction is monitored over time, and the following three plots are obtained:
- \( \mathrm{[A]} \) vs. \( \mathrm{t} \): curve downward
- \( \mathrm{\ln[A]} \) vs. \( \mathrm{t} \): straight line
- \( \mathrm{1/[A]} \) vs. \( \mathrm{t} \): curved upward
What is the order of the reaction with respect to \( \mathrm{A} \)?
▶️ Answer / Explanation
Step 1: Identify which graph is linear.
The plot of \( \mathrm{\ln[A]} \) vs. \( \mathrm{t} \) is linear.
Step 2: Apply the graphical rule.
If \( \mathrm{\ln[A]} \) vs. \( \mathrm{t} \) is linear → the reaction is first order with respect to \( \mathrm{A.} \)
Step 3: Interpret the slope.
Slope = \( \mathrm{-k} \), where \( \mathrm{k} \) is the rate constant.
Result: The reaction is first order in \( \mathrm{A} \).
First-Order Reactions and ln[Reactant] vs. Time Plot
For a first-order reaction, the rate is directly proportional to the concentration of one reactant. When the natural logarithm of concentration is plotted against time, the graph is a straight line with a slope equal to \( \mathrm{-k.} \)
Integrated Rate Law (First Order):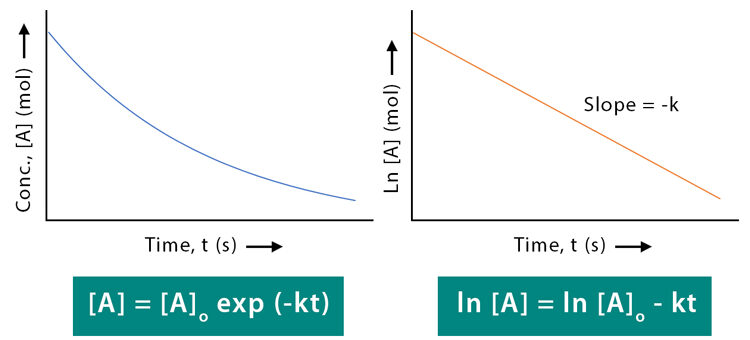
\( \mathrm{\ln[A] = \ln[A]_0 – kt} \)
- \( \mathrm{[A]} \): concentration at time \( \mathrm{t} \)
- \( \mathrm{[A]_0} \): initial concentration
- \( \mathrm{k} \): first-order rate constant
- \( \mathrm{t} \): time
Key Graphical Feature:
- Straight line when plotting \( \mathrm{\ln[A]} \) vs. \( \mathrm{t} \)
- Slope = \( \mathrm{-k} \)
- Intercept = \( \mathrm{\ln[A]_0} \)
Example —
Verify First-Order Kinetics For the decomposition of \( \mathrm{N_2O_5} \):
\( \mathrm{2N_2O_5(g) \rightarrow 4NO_2(g) + O_2(g)} \)
The following data are collected:
| Time (s) | \( \mathrm{[N_2O_5]\,(mol/L)} \) |
|---|---|
| 0 | 0.400 |
| 50 | 0.294 |
| 100 | 0.216 |
▶️ Answer / Explanation
Step 1: Plot \( \mathrm{\ln[N_2O_5]} \) vs. \( \mathrm{t} \).
Step 2: Observe linearity — the plot is a straight line, confirming first-order behavior.
Step 3: Calculate \( \mathrm{k} \) from slope:
\( \mathrm{slope = -k \Rightarrow k = -(\text{slope})} \)
Result: The decomposition of \( \mathrm{N_2O_5} \) is a first-order reaction where the natural log of concentration decreases linearly with time.
Second-Order Reactions and 1/[Reactant] vs. Time Plot
For a second-order reaction (rate proportional to the square of one reactant or to two different reactants), a plot of the reciprocal of concentration versus time gives a straight line.
Integrated Rate Law (Second Order):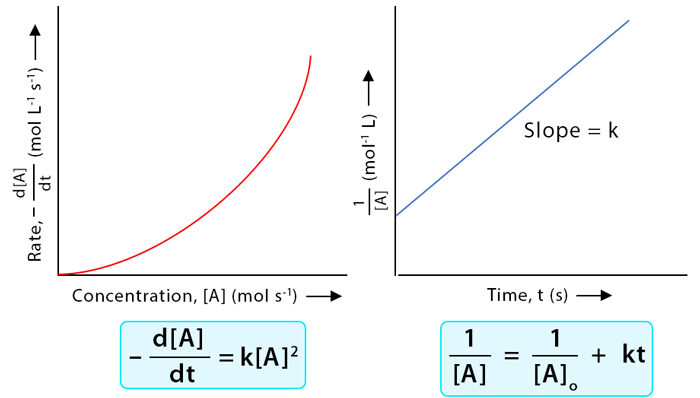
\( \mathrm{\dfrac{1}{[A]} = \dfrac{1}{[A]_0} + kt} \)
- \( \mathrm{[A]} \): concentration at time \( \mathrm{t} \)
- \( \mathrm{[A]_0} \): initial concentration
- \( \mathrm{k} \): second-order rate constant (\( \mathrm{L\,mol^{-1}\,s^{-1}} \))
Key Graphical Feature:
- Straight line when plotting \( \mathrm{1/[A]} \) vs. \( \mathrm{t} \)
- Slope = \( \mathrm{+k} \)
- Intercept = \( \mathrm{1/[A]_0} \)
For second-order kinetics, the rate slows down significantly as concentration decreases because rate ∝ \( \mathrm{[A]^2.} \)
Example
The decomposition of \( \mathrm{NO_2} \) was studied, and it was found that a plot of \( \mathrm{1/[NO_2]} \) vs. \( \mathrm{t} \) was linear. Determine the order of the reaction and explain what the slope represents.
▶️ Answer / Explanation
Step 1: The linearity of the \( \mathrm{1/[NO_2]} \) vs. \( \mathrm{t} \) plot indicates the reaction is second order.
Step 2: The slope of the line equals the rate constant \( \mathrm{k.} \)
Step 3: Use the slope to determine \( \mathrm{k} \) if needed.
\( \mathrm{k = slope = \dfrac{\Delta (1/[NO_2])}{\Delta t}} \)
Result: The reaction follows second-order kinetics, and the slope of the \( \mathrm{1/[NO_2]} \) vs. \( \mathrm{t} \) plot directly gives the rate constant in units of \( \mathrm{L\,mol^{-1}\,s^{-1}}. \)
Determining the Rate Constant from Graphical Data
The slope of a linear plot obtained from concentration versus time data (according to reaction order) can be used to determine the rate constant (\( \mathrm{k} \)) for a chemical reaction. Each reaction order produces a distinct linear relationship and slope sign.
The rate constant \( \mathrm{k} \) is found from the slope of the appropriate graph, depending on whether the reaction is zero, first, or second order.
Integrated Rate Law Equations and Slopes:
| Reaction Order | Integrated Rate Law | Linear Plot | Slope | Units of \( \mathrm{k} \) |
|---|---|---|---|---|
| Zero Order | \( \mathrm{[A]_t – [A]_0 = -kt} \) | \( \mathrm{[A]} \) vs. \( \mathrm{t} \) | \( \mathrm{-k} \) | \( \mathrm{mol\,L^{-1}\,s^{-1}} \) |
| First Order | \( \mathrm{\ln[A]_t – \ln[A]_0 = -kt} \) | \( \mathrm{\ln[A]} \) vs. \( \mathrm{t} \) | \( \mathrm{-k} \) | \( \mathrm{s^{-1}} \) |
| Second Order | \( \mathrm{\dfrac{1}{[A]_t} – \dfrac{1}{[A]_0} = kt} \) | \( \mathrm{1/[A]} \) vs. \( \mathrm{t} \) | \( \mathrm{+k} \) | \( \mathrm{L\,mol^{-1}\,s^{-1}} \) |
Key Observations:
- A negative slope (\( -k \)) occurs for zero- and first-order reactions.
- A positive slope (\( +k \)) occurs for second-order reactions.
- Units of \( \mathrm{k} \) depend on the overall reaction order.
- The slope magnitude gives the numerical value of \( \mathrm{k.} \)
Example
The decomposition of compound \( \mathrm{X} \) follows first-order kinetics. A graph of \( \mathrm{\ln[X]} \) vs. time yields a straight line with a slope of \( \mathrm{-0.0050\,s^{-1}.} \) Determine the rate constant and interpret its meaning.
▶️ Answer / Explanation
Step 1: For a first-order reaction, the slope of the \( \mathrm{\ln[X]} \) vs. time plot equals \( \mathrm{-k.} \)
\( \mathrm{slope = -k} \Rightarrow \mathrm{k = -(\text{slope})} \)
Step 2: Substitute the slope value.
\( \mathrm{k = -(-0.0050\,s^{-1}) = 0.0050\,s^{-1}} \)
Step 3: Interpret the result.
The rate constant \( \mathrm{k = 0.0050\,s^{-1}} \) indicates the fraction of \( \mathrm{X} \) that reacts per second under the given conditions.
Result: \( \mathrm{k = 5.0 \times 10^{-3}\,s^{-1}} \); the negative slope confirms first-order kinetics.
Half-Life of a First-Order Reaction
The half-life (\( \mathrm{t_{1/2}} \)) of a reaction is the time required for the concentration of a reactant to decrease to half of its initial value. For a first-order reaction, the half-life is independent of the initial concentration and depends only on the rate constant \( \mathrm{k.} \)
Mathematical Relationship (for First-Order Reactions):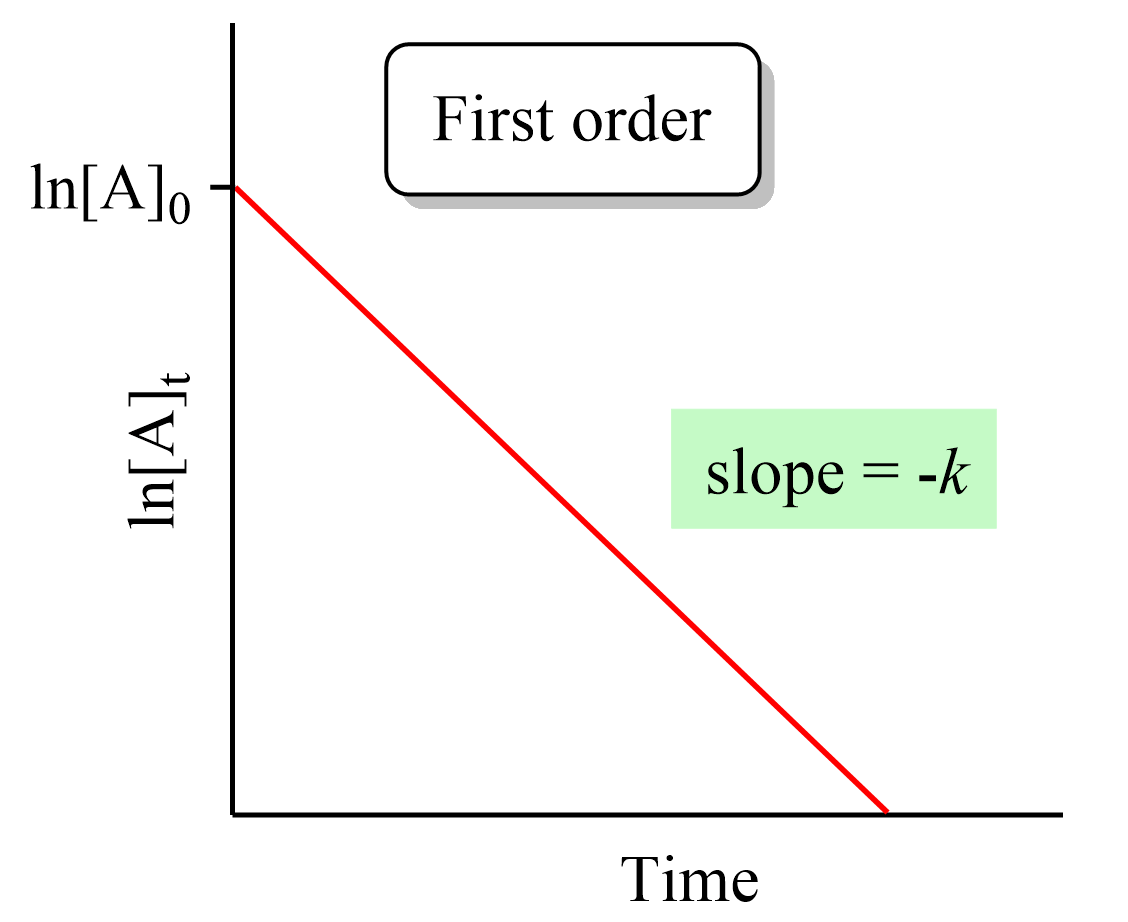
\( \mathrm{t_{1/2} = \dfrac{0.693}{k}} \)
- \( \mathrm{t_{1/2}} \): half-life (s)
- \( \mathrm{k} \): rate constant (\( \mathrm{s^{-1}} \))
- \( \mathrm{0.693 = \ln 2} \)
Derivation:
Start with the first-order integrated rate law: \( \mathrm{\ln[A]_t = \ln[A]_0 – kt} \)
At half-life, \( \mathrm{[A]_t = \dfrac{1}{2}[A]_0} \)
\( \mathrm{\ln\left(\dfrac{1}{2}[A]_0\right) = \ln[A]_0 – kt_{1/2}} \)
Simplify: \( \mathrm{\ln\dfrac{1}{2} = -kt_{1/2}\Rightarrow t_{1/2} = \dfrac{0.693}{k}} \)
For first-order reactions, half-life remains constant — every half-life period reduces the remaining concentration by half, regardless of how much reactant remains.
Example
The decomposition of \( \mathrm{N_2O_5} \) is first-order with a rate constant \( \mathrm{k = 3.0\times10^{-5}\,s^{-1}.} \) Calculate its half-life.
▶️ Answer / Explanation
Step 1: Use the formula \( \mathrm{t_{1/2} = \dfrac{0.693}{k}} \)
\( \mathrm{t_{1/2} = \dfrac{0.693}{3.0\times10^{-5}}} \)
Step 2: Solve for \( \mathrm{t_{1/2}} \):
\( \mathrm{t_{1/2} = 2.31\times10^{4}\,s} \)
Step 3: Convert to hours (if needed):
\( \mathrm{t_{1/2} = 6.4\,hours.} \)
Result: The half-life of \( \mathrm{N_2O_5} \) is \( \mathrm{2.31\times10^4\,s} \) (≈6.4 hours), independent of its initial concentration.
Radioactive Decay as a First-Order Process
Radioactive decay is a spontaneous process in which unstable nuclei emit radiation to form more stable nuclei. It follows first-order kinetics, meaning the rate of decay depends linearly on the number of undecayed nuclei present.
Mathematical Form (Rate Law):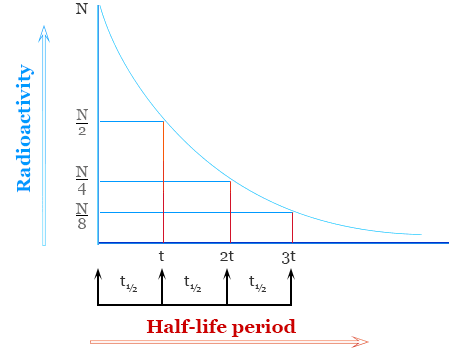
\( \mathrm{Rate = kN} \)
Integrated Form:
\( \mathrm{\ln N_t = \ln N_0 – kt} \)
- \( \mathrm{N_t} \): number of undecayed nuclei at time \( \mathrm{t} \)
- \( \mathrm{N_0} \): initial number of nuclei
- \( \mathrm{k} \): decay constant (\( \mathrm{s^{-1}} \))
Half-Life Relation:
\( \mathrm{t_{1/2} = \dfrac{0.693}{k}} \)
Radioactive decay provides a real-world example of a first-order process, where each half-life interval reduces the amount of radioactive isotope by half, regardless of how much remains.
Example
A radioactive isotope decays according to first-order kinetics with a decay constant \( \mathrm{k = 1.21\times10^{-4}\,s^{-1}.} \) Calculate its half-life, and determine how much of the isotope remains after three half-lives.
▶️ Answer / Explanation
Step 1: Calculate half-life using \( \mathrm{t_{1/2} = \dfrac{0.693}{k}} \):
\( \mathrm{t_{1/2} = \dfrac{0.693}{1.21\times10^{-4}} = 5.73\times10^{3}\,s} \)
Step 2: Determine fraction remaining after 3 half-lives.
Each half-life reduces the amount by ½, so after 3 half-lives:
\( \mathrm{\left(\dfrac{1}{2}\right)^3 = \dfrac{1}{8} = 12.5\%} \)
Result: The isotope has a half-life of \( \mathrm{5.73\times10^{3}\,s} \) (≈1.6 hours), and 12.5% of the original sample remains after three half-lives.