Bond Breaking and Bond Formation in Elementary Reactions
An elementary reaction typically involves both the breaking of some existing chemical bonds and the formation of new bonds as reactant molecules are converted into products. These bond changes occur during the collision and rearrangement process that defines the reaction mechanism.
Key Concept:
- When reactant molecules collide with sufficient energy, certain bonds in the reactants stretch and break.

- At the same time, new bonds begin to form between atoms to produce the products.
- This simultaneous breaking and forming of bonds occurs through an unstable, high-energy intermediate called the transition state.

\( \mathrm{Reactants \xrightarrow{collision} [Transition\ State] \rightarrow Products} \)
Bond Energy Concept:
- Breaking bonds requires energy (endothermic step).
- Forming new bonds releases energy (exothermic step).
- The overall energy change of the reaction (\( \mathrm{\Delta E} \) or \( \mathrm{\Delta H} \)) depends on the balance between these two processes.
\( \mathrm{\Delta H_{rxn} = \text{Energy to break bonds} – \text{Energy released when bonds form}} \)
Elementary reactions represent the microscopic steps of a mechanism, each corresponding to a single collision event where bonds are broken and new ones form — often through a single transition state.
Example
Describe what happens to the bonds during the elementary reaction:
\( \mathrm{H_2 + I_2 \rightarrow 2HI} \)
▶️ Answer / Explanation
Step 1: When \( \mathrm{H_2} \) and \( \mathrm{I_2} \) molecules collide with sufficient energy, the H–H and I–I bonds begin to stretch and weaken.
Step 2: At the transition state, both old bonds are partially broken while new H–I bonds start forming.
Step 3: As bond formation completes, the system releases energy, producing two molecules of hydrogen iodide:
\( \mathrm{H_2 + I_2 \rightarrow 2HI} \)
Result: The reaction involves simultaneous bond breaking (endothermic) and bond forming (exothermic). The balance between these processes determines whether the reaction releases or absorbs heat overall.
The Reaction Coordinate
The reaction coordinate is an abstract axis that represents the progress of a chemical reaction — showing how the structure and energy of the system change as reactants are converted into products. It reflects the complex set of atomic motions (bond breaking and bond making) that occur during the reaction process.
Key Concept:
- The reaction coordinate tracks the system’s movement from reactants → transition state → products.
- It does not correspond to a physical distance or time, but rather to the extent of reaction progress.
- Along this coordinate, energy changes are plotted to create the reaction energy profile.
Representation: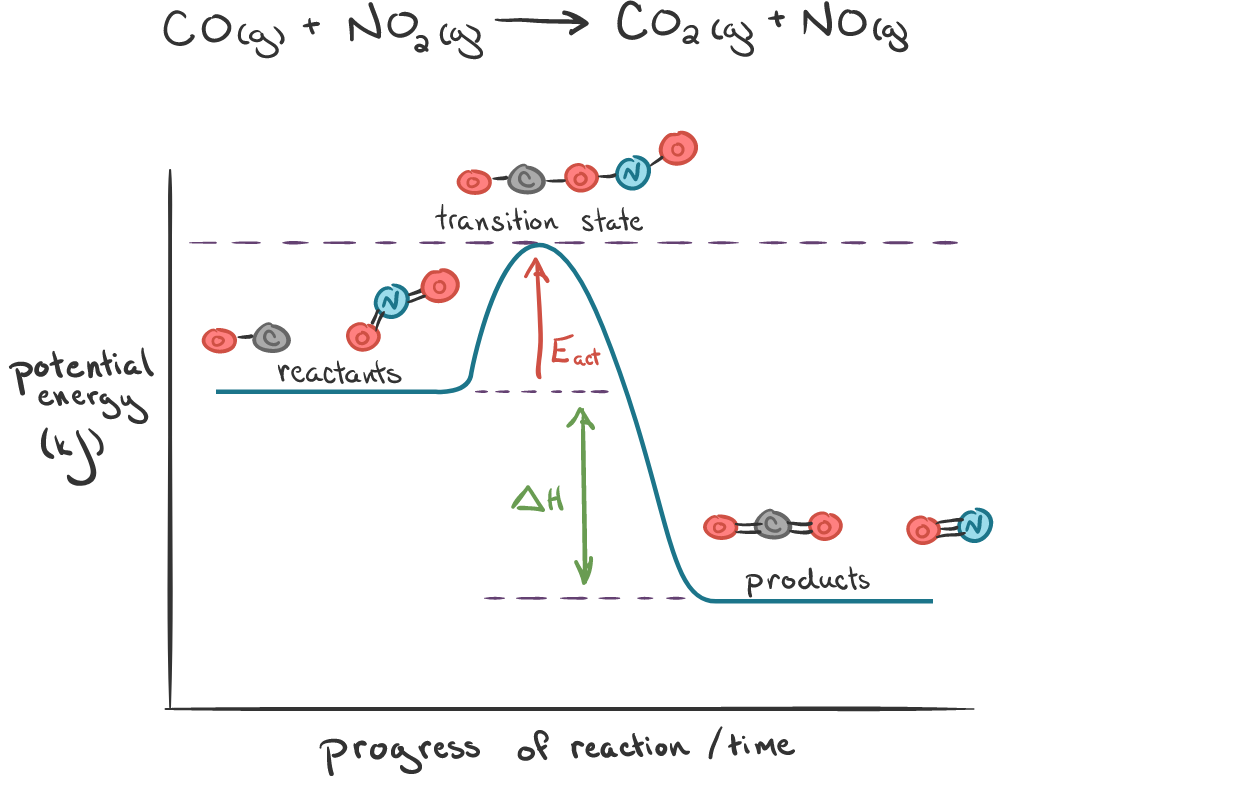
\( \mathrm{Reactants \; \xrightarrow{Reaction\ Coordinate} \; Transition\ State \; \xrightarrow{Reaction\ Coordinate} \; Products} \)
At each point along the coordinate:
- Bond lengths and angles are continuously changing.
- Potential energy varies depending on how stable the configuration is.
- The peak corresponds to the transition state — the highest-energy configuration.
Graphical Meaning:
The reaction coordinate appears on the x-axis of an energy profile diagram, while potential energy appears on the y-axis. It provides a visual representation of how the energy of the system changes as the reaction proceeds.
The reaction coordinate is the “pathway” connecting reactants to products — it summarizes all molecular rearrangements (bond breaking, bond forming, orientation shifts) that occur during the transformation.
Example
What does the reaction coordinate represent in the energy profile of the reaction \( \mathrm{H_2 + I_2 \rightarrow 2HI?} \)
▶️ Answer / Explanation
Step 1: As \( \mathrm{H_2} \) and \( \mathrm{I_2} \) molecules approach each other, their bond distances begin to stretch.
Step 2: Along the reaction coordinate, the system passes through the transition state where the old \( \mathrm{H–H} \) and \( \mathrm{I–I} \) bonds are partially broken, and new \( \mathrm{H–I} \) bonds are forming.
Step 3: Continuing along the coordinate, energy decreases as stable \( \mathrm{HI} \) molecules form.
Result: The reaction coordinate represents the continuous structural and energetic changes that connect the reactants (\( \mathrm{H_2 + I_2} \)) to the products (\( \mathrm{2HI} \)) through the transition state.
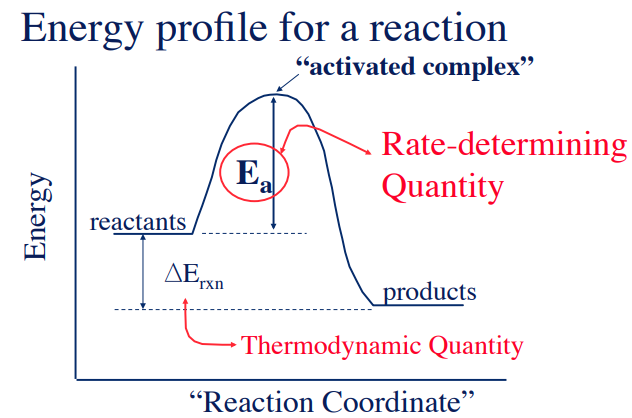
Reaction Energy Profile and Activation Energy
A reaction energy profile (or potential energy diagram) shows how the energy of the system changes along the reaction coordinate as reactants are transformed into products. It illustrates the formation of the transition state, the activation energy, and the overall energy change of the reaction.
Features of an Energy Profile Diagram
The y-axis represents the potential energy of the system, and the x-axis represents the reaction coordinate.
Key Points on the Diagram:
- Reactants: Starting energy level of the system.
- Transition State (Activated Complex):
- The highest point on the energy curve.
- Represents a short-lived, unstable arrangement of atoms.
- Bonds are partially broken and partially formed.
- Products: Final energy level of the system after the reaction completes.
Activation Energy (\( \mathrm{E_a} \)):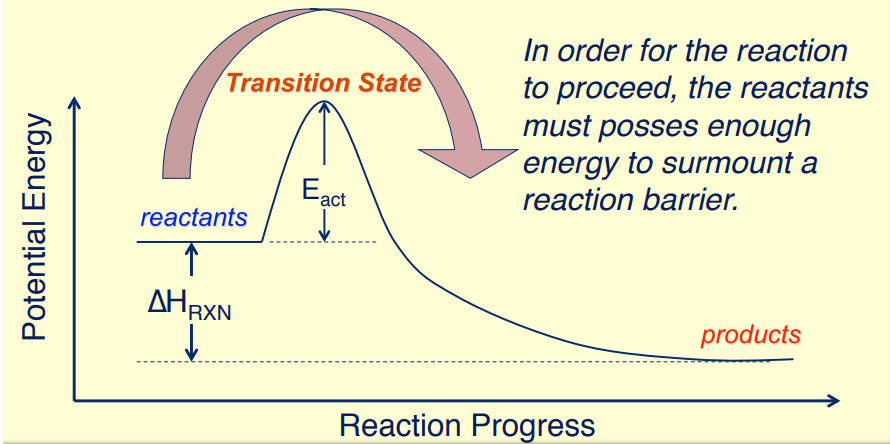
- The energy difference between the reactants and the transition state.
- It is the minimum energy required for the reaction to occur.
Energy Relationships
\( \mathrm{E_a (forward) = E_{TS} – E_{reactants}} \)
\( \mathrm{E_a (reverse) = E_{TS} – E_{products}} \)
\( \mathrm{\Delta E_{rxn} = E_{products} – E_{reactants}} \)
- If \( \mathrm{\Delta E_{rxn} < 0} \): reaction is exothermic (energy released).
- If \( \mathrm{\Delta E_{rxn} > 0} \): reaction is endothermic (energy absorbed).
The activation energy barrier represents the minimum energy needed to reach the transition state. The height of this barrier determines the rate of the reaction — higher \( \mathrm{E_a} \) means slower reaction, lower \( \mathrm{E_a} \) means faster reaction.
Example
The reaction \( \mathrm{A + B \rightarrow AB} \) has a transition state energy of \( \mathrm{250\,kJ/mol} \). The energy of the reactants is \( \mathrm{100\,kJ/mol} \), and the products are \( \mathrm{50\,kJ/mol.} \) Determine the activation energy for the forward reaction and the overall energy change.
▶️ Answer / Explanation
Step 1: Use formulas:
- \( \mathrm{E_a (forward) = E_{TS} – E_{reactants}} \)
- \( \mathrm{\Delta E_{rxn} = E_{products} – E_{reactants}} \)
Step 2: Substitute values:
\( \mathrm{E_a = 250 – 100 = 150\,kJ/mol} \)
\( \mathrm{\Delta E_{rxn} = 50 – 100 = -50\,kJ/mol} \)
Step 3: Interpret results:
- The reaction requires \( \mathrm{150\,kJ/mol} \) to overcome the activation barrier.
- \( \mathrm{\Delta E_{rxn} = -50\,kJ/mol} \) indicates an exothermic reaction.
Result: Activation energy = \( \mathrm{150\,kJ/mol} \), and the reaction releases \( \mathrm{50\,kJ/mol} \) of energy.
Temperature Dependence of Reaction Rate and the Arrhenius Equation
The rate of an elementary reaction increases with temperature because a higher temperature increases the fraction of collisions that possess enough energy to reach the transition state and form products. This dependence is quantitatively described by the Arrhenius equation.
- At higher temperatures, molecules move faster and collide more frequently.
- More importantly, a greater fraction of molecules have energy ≥ activation energy, allowing them to overcome the energy barrier.
- This means that the reaction proceeds faster because more effective collisions occur per unit time.

The Arrhenius Equation:
\( \mathrm{k = A e^{-\dfrac{E_a}{RT}}} \)
- \( \mathrm{k} \): rate constant
- \( \mathrm{A} \): frequency factor (collision frequency and orientation)
- \( \mathrm{E_a} \): activation energy(J/mol)
- \( \mathrm{R} \): gas constant (\( \mathrm{8.314\,J\,mol^{-1}K^{-1}} \))
- \( \mathrm{T} \): absolute temperature (K)
Key Features:
- The term \( \mathrm{e^{-\dfrac{E_a}{RT}}} \) represents the fraction of molecules with enough energy to react.
- As \( \mathrm{T} \) increases, \( \mathrm{e^{-\dfrac{E_a}{RT}}} \) increases exponentially — leading to a faster reaction rate.
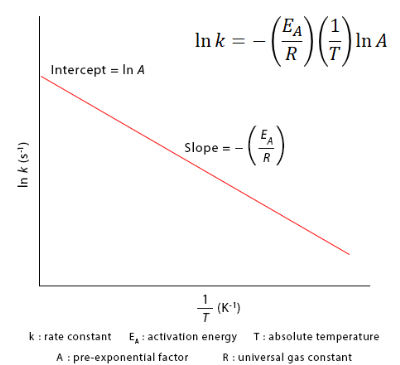
- A plot of \( \mathrm{\ln k} \) versus \( \mathrm{1/T} \) yields a straight line with slope \( \mathrm{-E_a/R.} \)
Linear Form of the Arrhenius Equation:
\( \mathrm{\ln k = \ln A – \dfrac{E_a}{R}\left(\dfrac{1}{T}\right)} \)
| Variable | Graph Axis | Graph Type | Information Obtained |
|---|---|---|---|
| \( \mathrm{\ln k} \) | y-axis | Linear | Rate constant behavior |
| \( \mathrm{1/T} \) | x-axis | Inverse of temperature | Temperature effect |
| Slope | — | \( \mathrm{-E_a/R} \) | Gives activation energy |
The rate constant \( \mathrm{k} \) increases exponentially with temperature because higher temperatures allow a larger fraction of particles to have energy greater than or equal to the activation energy . Thus, even small temperature increases can greatly accelerate reaction rates.
Example
The rate constant \( \mathrm{k} \) for a reaction is \( \mathrm{1.2\times10^{-3}\,s^{-1}} \) at \( \mathrm{300\,K} \) and \( \mathrm{9.6\times10^{-3}\,s^{-1}} \) at \( \mathrm{350\,K.} \) Calculate the activation energy (\( \mathrm{E_a} \)) of the reaction.
▶️ Answer / Explanation
Step 1: Use two-point Arrhenius equation:
\( \mathrm{\ln\left(\dfrac{k_2}{k_1}\right) = \dfrac{E_a}{R}\left(\dfrac{1}{T_1} – \dfrac{1}{T_2}\right)} \)
Step 2: Substitute values:
\( \mathrm{\ln\left(\dfrac{9.6\times10^{-3}}{1.2\times10^{-3}}\right) = \dfrac{E_a}{8.314}\left(\dfrac{1}{300} – \dfrac{1}{350}\right)} \)
Step 3: Simplify:
\( \mathrm{\ln(8) = \dfrac{E_a}{8.314}(0.000476 – 0.000401)} \)
\( \mathrm{2.079 = \dfrac{E_a}{8.314}(0.000075)} \)
Step 4: Solve for \( \mathrm{E_a} \):
\( \mathrm{E_a = \dfrac{2.079 \times 8.314}{0.000075} = 2.3\times10^5\,J/mol = 230\,kJ/mol.} \)
Result: The activation energy for the reaction is \( \mathrm{230\,kJ/mol.} \)