Statistics Class 11 MCQs Questions with Answers
Question 1.
The sum of 10 items is 12 and the sum of their squares is 18. The standard deviation is
(a) 1/5
(b) 2/5
(c) 3/5
(d) 4/5
Answer
Answer: (c) 3/5
Hint:
Given, ∑x = 12 and ∑x² = 18
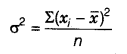
Now, varience = ∑x²/n – (∑x/n)²
⇒ varience = 18/10 – (12/10)²
⇒ varience = 9/5 – (6/5)²
⇒ varience = 9/5 – 36/25
⇒ varience = (9 × 5 – 36)/25
⇒ varience = (45 – 36)/25
⇒ varience = 9/25
⇒ Standard deviation = √(9/25)
⇒ Standard deviation = 3/5
Question 2.
The algebraic sum of the deviation of 20 observations measured from 30 is 2. So, the mean of observations is
(a) 30.0
(b) 30.1
(c) 30.2
(d) 30.3
Answer
Answer: (b) 30.1
Hint:
Given, algebraic sum of of the deviation of 20 observations measured from 30 is 2
⇒ ∑(xi – 30) = 2 {1 ≤ i ≤ 20}
⇒ ∑xi – 30 × 20 = 2
⇒ (∑xi)/20 – (30 × 20)/20 = 2/20
⇒ (∑xi)/20 – 30 = 0.1
⇒ Mean – 30 = 0.1
⇒ Mean = 30 + 0.1
⇒ Mean = 30.1
Question 3.
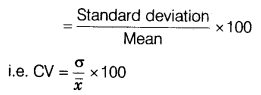
The coefficient of variation is computed by
(a) S.D/.Mean×100
(b) S.D./Mean
(c) Mean./S.D×100
(d) Mean/S.D.
Answer
Answer: (b) S.D./Mean
Hint:
The coefficient of variation = S.D./Mean
Question 4.
When tested the lives (in hours) of 5 bulbs were noted as follows: 1357, 1090, 1666, 1494, 1623. The mean of the lives of 5 bulbs is
(a) 1445
(b) 1446
(c) 1447
(d) 1448
Answer
Answer: (b) 1446
Hint:
Given, lives (in hours) of 5 bulbs were noted as follows: 1357, 1090, 1666, 1494, 1623
Now, mean = (1357 + 1090 + 1666 + 1494 + 1623)/5
= 7230/5
= 1446
Question 5.
If mode of a series exceeds its mean by 12, then mode exceeds the median by
(a) 4
(b) 8
(c) 6
(d) 12
Answer
Answer: (b) 8
Hint:
Given, Mode = Mean + 12
⇒ Mode – 12 = Mean
Now, Mode = 3×Median – 2×Mean
⇒ Mode = 3×Median – 2(Mode – 12)
⇒ Mode = 3×Median – 2×Mode + 24
⇒ Mode + 2×Mode = 3×Median + 24
⇒ 3×Mode = 3×Median = 24
⇒ Mode = Median + 8
So, mode exceeds the median by 8
Question 6.
The median and SD of a distributed are 20 and 4 respectively. If each item is increased by 2, the new median and SD are
(a) 20, 4
(b) 22, 6
(c) 22, 4
(d) 20, 6
Answer
Answer: (c) 22, 4
Hint:
Since each value is increased by 2, therefore the median value is also increased by
2. So, new median = 22
Again, the variance is independent of the change of origin. So it remains the same.
Question 7.
Range of the data 4, 7, 8, 9, 10, 12, 13 and 17 is
(a) 4
(b) 17
(c) 13
(d) 21
Answer
Answer: (c) 13
Hint:
Give, data are: 4, 7, 8, 9, 10, 12, 13 and 17
Range = Maximum value – Minimum Value
= 17 – 4
= 13
Question 8.
If Mean = Median = Mode, then it is
(a) Symmetric distribution
(b) Asymmetric distribution
(c) Both symmetric and asymmetric distribution
(d) None of these
Answer
Answer: (a) Symmetric distribution
Hint:
In a symmetric distribution,
Mean = Median = Mode
Question 9.
If the difference of mode and median of a data is 24, then the difference of median and mean is
(a) 12
(b) 24
(c) 8
(d) 36
Answer
Answer: (a) 12
Hint:
Given the difference of mode and median of a data is 24
⇒ Mode – Median = 24
⇒ Mode = Median + 24
Now, Mode = 3×Median – 2×Mean
⇒ Median + 24 = 3×Median – 2×Mean
⇒ 24 = 3×Median – 2×Mean – Median
⇒ 24 = 2×Median – 2×Mean
⇒ Median – Mean = 24/2
⇒ Median – Mean = 12
Question 10.
If r is the correlation coefficient, then
(a) |r| ≤ 1
(b) r ≤ 1
(c) |r| ≥ 1
(d) r ≥ 1
Answer
Answer: (a) |r| ≤ 1
Hint:
If r is the correlation coefficient, then |r| ≤ 1
Question 11.
If the varience of the data is 121 then the standard deviation of the data is
(a) 121
(b) 11
(c) 12
(d) 21
Answer
Answer: (b) 11
Hint:
Given, varience of the data = 121
Now, the standard deviation of the data = √(121) = 11
Question 12.
If the mean of the following data is 20.6, then the value of p is
x = 10 15 p 25 35
f = 3 10 25 7 5
(a) 30
(b) 20
(c) 25
(d) 10
Answer
Answer: (b) 20
Hint:
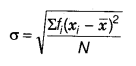
Mean = ∑ f i× x i /∑ f i
⇒ 20.6 = (10 × 3 + 15 × 10 + p × 25 + 25 × 7 + 35 × 5)/(3 + 10 + 25 + 7 + 5)
⇒ 20.6 = (30 + 150 + 25p + 175 + 175)/50
⇒ 20.6 = (530 + 25p)/50
⇒ 530 + 25p = 20.6 × 50
⇒ 530 + 25p = 1030
⇒ 25p = 1030 – 530
⇒ 25p = 500
⇒ p = 500/25
⇒ p = 20
So, the value of p is 20
Question 13.
If the mean of first n natural numbers is 5n/9, then n =
(a) 5
(b) 4
(c) 9
(d) 10
Answer
Answer: (c) 9
Hint:
Given mean of first n natural number is 5n/9
⇒ (n+1)/2 = 5n/9
⇒ n + 1 = (5n×2)/9
⇒ n + 1 = 10n/9
⇒ 9(n + 1) = 10n
⇒ 9n + 9 = 10n
⇒ 10n – 9n = 9
⇒ n = 9
Question 14.
If one of the observation is zero then geometric mean is
(a) (Sum of observation)/n
(b) (Multiplication of all observations)n
(c) (Multiplication of all observations)1/n
(d) 0
Answer
Answer: (d) 0
Hint:
Let the observations are 0, a, b, c, ……… up to n
Now, geometric mean = (0 × a × b × c × ……… up to n)1/n
= 0
So, geometric mean is 0
Question 15.
Which one is measure of dispersion method
(a) Renge
(b) Quartile deviation
(c) Mean deviation
(d) all of the above
Answer
Answer: (d) all of the above
Hint:
Range, Quartile deviation, Mean deviation all are the measure of dispersions method.
Question 16.
If a variable takes discrete values x + 4, x – 7/2, x – 5/2, x – 3, x – 2, x + 1/2, x – 1/2, x + 5 (x > 0), then the median is
(a) x – 5/4
(b) x – 1/2
(c) x – 2
(d) x + 5/4
Answer
Answer: (a) x – 5/4
Hint:
Given, discrete values x + 4, x – 7/2, x – 5/2, x – 3, x – 2, x + 1/2, x – 1/2, x + 5
Now, arrange them in ascending order, we get
x – 7/2, x – 3, x – 5/2, x – 2, x – 1/2, x + 1/2, x + 4, x + 5
Total observations = 8
Now, median = AM of 4th and 5th observations
= AM of (x – 2) and (x – 1/2) observations
= (x – 2 + x – 1/2)/2
= (2x – 5/2)/2
= x – 5/4
Question 17.
If covariance between two variables is 0, then the correlation coefficient between them is
(a) nothing can be said
(b) 0
(c) positive
(d) negative
Answer
Answer: (b) 0
Hint:
The relationship between the correlation coefficient and covariance for two variables as shown below:
r(x, y) = COV(x, y)/{sx × sy}
r(x, y) = correlation of the variables x and y
COV(x, y) = covariance of the variables x and y
sx = sample standard deviation of the random variable x
sx = sample standard deviation of the random variable y
Now given COV(x, y) = 0
Then r(x, y) = 0
Question 18.
The mean of a group of 100 observations was found to be 20. Later on, it was found that three observations were incorrect, which was recorded as 21, 21 and 18. Then the mean if the incorrect observations are omitted is
(a) 18
(b) 20
(c) 22
(d) 24
Answer
Answer: (b) 20
Hint:
Given mean of 100 observations is 20
Now
∑ xi/100 = 20 (1 = i = 100)
⇒ ∑xi = 100×20
⇒ ∑xi = 2000
3 observations 21, 21 and 18 are recorded in-correctly.
So ∑xi = 2000 – 21 – 21 – 18
⇒ ∑xi = 2000 – 60
⇒ ∑xi = 1940
Now new mean is
∑ xi/100 = 1940/97 = 20
So, the new mean is 20
Question 19.
Varience is independent of change of
(a) origin only
(b) scale only
(c) origin and scale both
(d) None of these
Answer
Answer: (a) origin only
Hint:
Varience is independent of change of origin only.
Question 20.
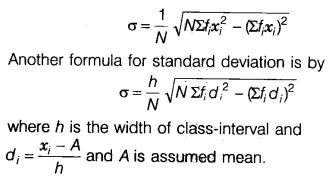
Let x1, x2, x3, ……… , xn, be n observations and X be the arithmetic mean. Then formula for the standard deviation is given by
(a) ∑(xi – mean)²
(b) ∑(xi – mean)2 /n
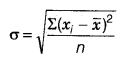
(c) √{∑(xi – mean)²/n}
(d) None of these
Answer
Answer: (c) √{∑(xi – mean)²/n}
Hint:
Given, x1, x2, x3, ………. , xn be n observations and X be the arithmetic mean.
Now standard deviation = √{∑(xi – mean)²/n}