At a summer camp an arithmetic test is taken by 250 children. The times taken, to the nearest minute, to complete the test were recorded. The results are summarised in the table.
| Time taken, in minutes | 1-30 | 31-45 | 46-65 | 66-75 | 76-100 |
| Frequency | 21 | 30 | 68 | 86 | 45 |
(a) Question
Draw a histogram to represent this information.
Answer/Explanation
Ans:
| Class Width | 30 | 15 | 20 | 10 | 25 |
| Frequency Density | 0.7 | 2 | 3.4 | 8.6 | 1.8 |
Question
A driver records the distance travelled i each of 150 journeys. These distances, correct to the nearest km, are summarised in the following table.
| Distance(km) | 0-4 | 5-10 | 11-20 | 21-30 | 31-40 | 41-60 |
| Frequency | 12 | 16 | 32 | 66 | 20 | 4 |
(a) Draw a cumulative frequency graph to illustrate the data.
(b) For 30% of these journeys the distance travelled is d km or more.
Use your graph to estimate the value of d.
(c) Calculate an estimate of the mean distance travelled for the 150 journeys.
Answer/Explanation
Ans:
(a)
| Distance | 0-4 | 5-10 | 11-20 | 21-30 | 31-40 | 41-60 |
| Upper boundary | 4-5 | 10-5 | 20-5 | 30-5 | 40.5 | 60-5 |
| Cumulative frequency | 12 | 28 | 60 | 126 | 146 | 150 |
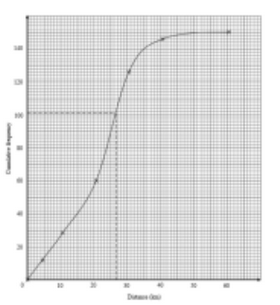
(b) 70% of 150 = 105
Approx. 27
(c) Midpoints: 2.25, 7.5, 15.5, 25.5, 35.5, 50.5
Mean = \(\frac{2.25 \times 12 + 7.5 \times 16+ + 15.5 \times 32 + 25.5 \times 66 + 65.5 \times 20 + 50.5 \times 4}{150}\)
\(=\frac{27+120+496+1686+710+202}{150}\)
\([=\frac{3238}{150}]=21.6, 21\frac{44}{75}\)
Question
Helen measures the lengths of 150 fish of a certain species in a large pond. These lengths, correct to the nearest centimetre, are summarised in the following table.
| Length(cm) | 0-9 | 10-14 | 15-19 | 20-30 |
| Frequency | 15 | 48 | 66 | 21 |
(a) Draw a cumulative frequency graph to illustrate the data.
(b) 40% of these fish have of d cm or more. Use your graph to estimate the value of d.
The mean length of these 150 fish is 15.295 cm.
(c) Calculate an estimate for the variance of the lengths of the fish.
Answer/Explanation
Ans:
(a) 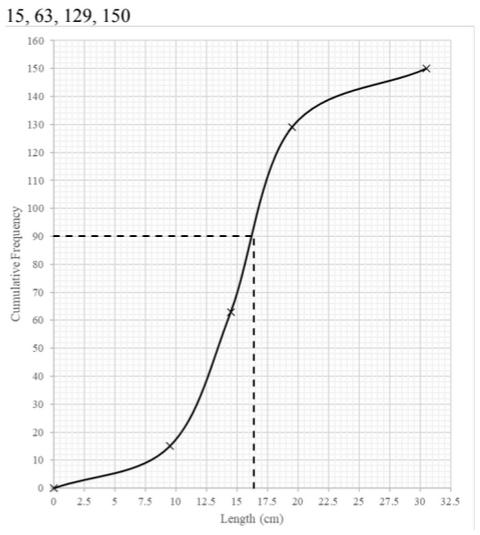
(b) 60% of 150 = 90
Approx. 16.5 [cm]
(c) Midpoints: 4.75, 12, 17, 25
Var = \(4.75^2 \times 15 + 12^2 \times 48 + 17^2 \times 66 + 25^2 \times 21}{150}-15.295^2\)
= 29.1
Question 4.
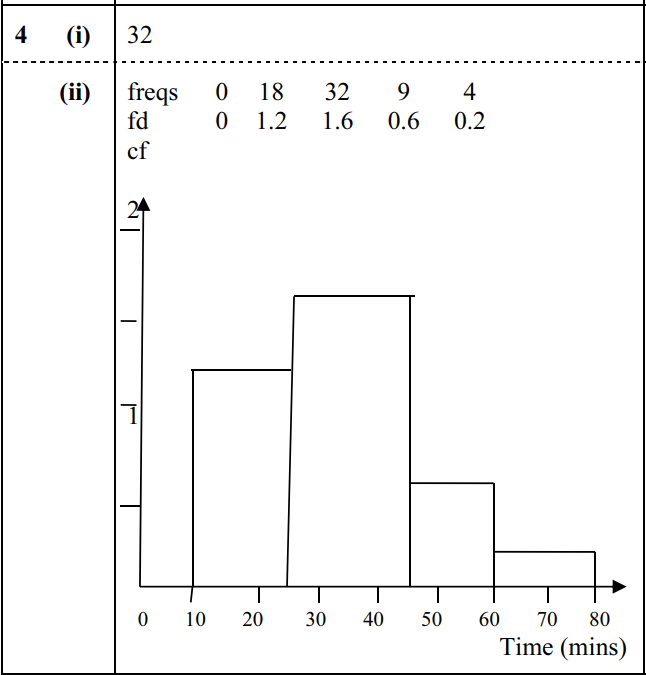
4 A survey was made of the journey times of 63 people who cycle to work in a certain town. The results are summarised in the following cumulative frequency table.
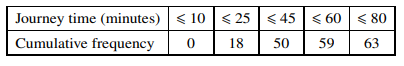
(i) State how many journey times were between 25 and 45 minutes. [1]
(ii) Draw a histogram on graph paper to represent the data. [4]
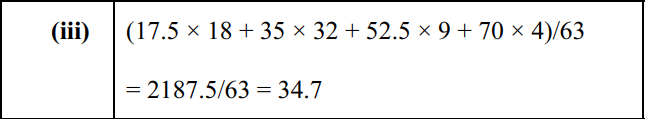
(iii) Calculate an estimate of the mean journey time. [2]
Answer/Explanation
Ans:
Question
Box A contains 7 red balls and 1 blue ball. Box B contains 9 red balls and 5 blue balls. A ball is chosen at random from box A and placed in box B. A ball is then chosen at random from box B. The tree diagram below shows the possibilities for the colours of the balls chosen.
(a) Complete the tree diagram to show the probabilities.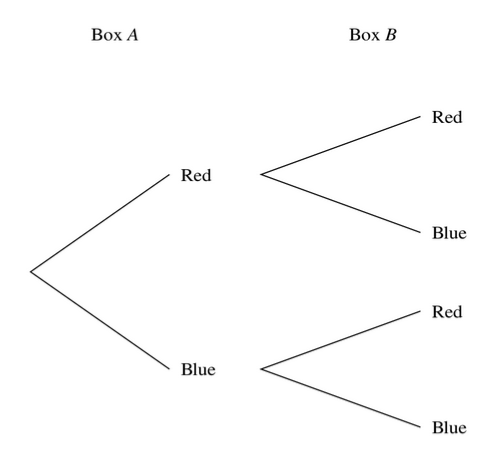
(b) Find the probability that the two balls chosen are not the same colour.
(c) Find the probability that the ball chosen form box A is blue given that given that the ball chosen form box B is blue
Answer/Explanation
Ans:
(a)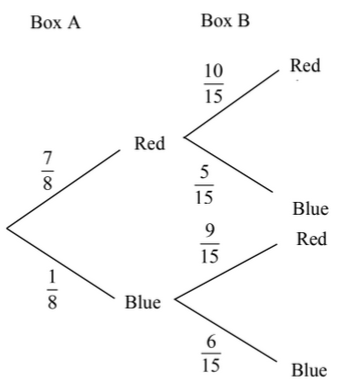
(b) \(\frac{7}{8} \times \frac{5}{15}+\frac{1}{8} \times \frac{9}{15}\)
\(=\frac{44}{120}[\frac{11}{30}or0.367]\)
(c) P(A blue|B blue) \(=\frac{A blue \bigcap B blue)}{P(B blue)}\)
\(=\frac{\frac{1}{8}\times \frac{6}{15}}{\frac{7}{8}\times \frac{5}{15}+\frac{1}{8}\times \frac{6}{15}}=\frac{\frac{1}{20}}{\frac{41}{120}}\)
\(=\frac{6}{41}\) or 0.146
Question
The numbers of chocolate bars sold per day in a cinema over a period of 100 days are summarised in
the following table.
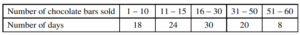
(a) Draw a histogram to represent this information. [5]

(b) What is the greatest possible value of the interquartile range for the data? [2]
(c) Calculate estimates of the mean and standard deviation of the number of chocolate bars sold. [4]
Answer/Explanation
Ans
7 (a) Class widths: 10, 5, 15, 20, 10
Frequency density = frequency/their class width: 1.8, 4.8, 2, 1, 0.8
All heights correct on diagram (using a linear scale)
Correct bar ends
Bar ends: 10.5, 15.5, 30.5, 50.5, 60.5
7 (b) 11 – 15 and 31 – 50 B1
Greatest IQR = 50 – 11 = 39
7 (c) \(Mean=\frac{18\times 5.5+24\times 13+30\times 23+20\times 40.5+8\times 55.5}{100}=\frac{2355}{100}=23.6\)
\(Var=\frac{18\times 5.5^{2}+24\times 13^{2}+30\times 23^{2}+20\times 40.5^{2}+8\times 55.5^{2}}{100}-mean^{2}\)
\(\frac{77917.5}{100}-mean^{2}=224.57\)
Standard deviation = 15.0
(FT their variance)
Question
On Mondays, Rani cooks her evening meal. She has a pizza, a burger or a curry with probabilities
0.35, 0.44, 0.21 respectively. When she cooks a pizza, Rani has some fruit with probability 0.3.
When she cooks a burger, she has some fruit with probability 0.8. When she cooks a curry, she never
has any fruit.
(a) Draw a fully labelled tree diagram to represent this information. [2]
(b) Find the probability that Rani has some fruit. [2]
(c) Find the probability that Rani does not have a burger given that she does not have any fruit. [4]
Answer/Explanation
Ans
5 (a) 
Fully correct labelled tree for method of transport with correct probabilities.
Fully correct labelled branches with correct probabilities for lateness with either 1 branch after W or 2 branches with the prob 0
5 (b) 0.35 × 0.3 + 0.44 × 0.8 (+ 0)
0.457
5 (c) P(not B|not fruit) \(=\frac{P(B’\cap F’)}{P(F’)}\)
\(\frac{0.35\times 0.7+0.21\times 1}{1-their(b)}\)
\(\frac{0.455}{0.543}\)
(M1 for 1 – their (b) or summing three appropriate 2-factor probabilities, correct or consistent with their tree diagram as
denominator)
\(0.838\ or \ \frac{455}{543}\)
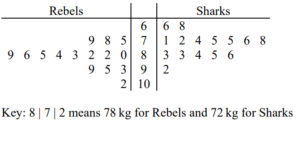
The weights, in kg, of 15 rugby players in the Rebels club and 15 soccer players in the Sharks club are shown below.
| Rebels | 75 | 78 | 79 | 80 | 82 | 82 | 83 | 84 | 85 | 86 | 89 | 93 | 95 | 99 | 102 |
| Sharks | 66 | 68 | 71 | 72 | 74 | 75 | 75 | 76 | 78 | 83 | 83 | 84 | 85 | 86 | 92 |
(a) Question
Represent the data by drawing a back-to-back stem-and-leaf diagram with Rebels on the left-hand side of the diagram.
Answer/Explanation
Ans:
(b) Question
Find the median and the interquartile range for the Rebels.
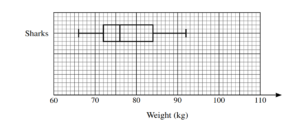
A box-and-whisker plot for the Sharks is shown below.
Answer/Explanation
Ans:
Median = 84 (kg)
[UQ = 93, LQ = 80] 93 – 80
[IQR =] 13 (kg)
Question
The times, t minutes, taken by 150 students to complete a particular challenge are summarised in the
following cumulative frequency table.
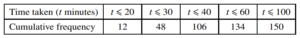
(a) Draw a cumulative frequency graph to illustrate the data. [2]

(b) 24% of the students take k minutes or longer to complete the challenge. Use your graph to
estimate the value of k. [2]
(c) Calculate estimates of the mean and the standard deviation of the time taken to complete the
challenge. [6]
Answer/Explanation
Ans
6 (a) 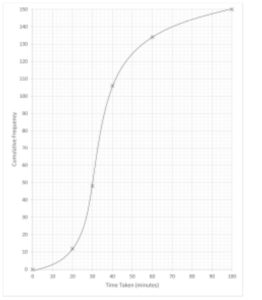
Correct cumulative frequency curve
6 (b) 150× 0·76 = 114
k = 45 (mins)
6 (c) Frequencies: 12 36 58 28 16
\(Mean=\frac{10\times 12 \times 25 \times 36\times 35\times 58 \times 50 \times 28\times 80\times 16}{150}\)
\(\frac{120 + 900 + 2030+ 1400 + 1280}{150}\)
\(38.2, 38\frac{1}{5}\)
\(Variance=\frac{12\times 10^{2}\times 36\times 25^{2}\times 58\times 35^{2}\times 28\times 50^{2}\times 16\times 80^{2}}{150}-mean^{2}\)
\(=\frac{1200 + 22500 + 71050 + 70000 + 102400}{150}-mean^{2}\)
(Standard deviation \(=\sqrt{321.76}=17.9\)