At a summer camp an arithmetic test is taken by 250 children. The times taken, to the nearest minute, to complete the test were recorded. The results are summarised in the table.
| Time taken, in minutes | 1-30 | 31-45 | 46-65 | 66-75 | 76-100 |
| Frequency | 21 | 30 | 68 | 86 | 45 |
(a) Question
Draw a histogram to represent this information.
Answer/Explanation
Ans:
| Class Width | 30 | 15 | 20 | 10 | 25 |
| Frequency Density | 0.7 | 2 | 3.4 | 8.6 | 1.8 |
Question 4.
4 A survey was made of the journey times of 63 people who cycle to work in a certain town. The results are summarised in the following cumulative frequency table.
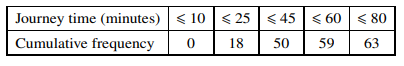
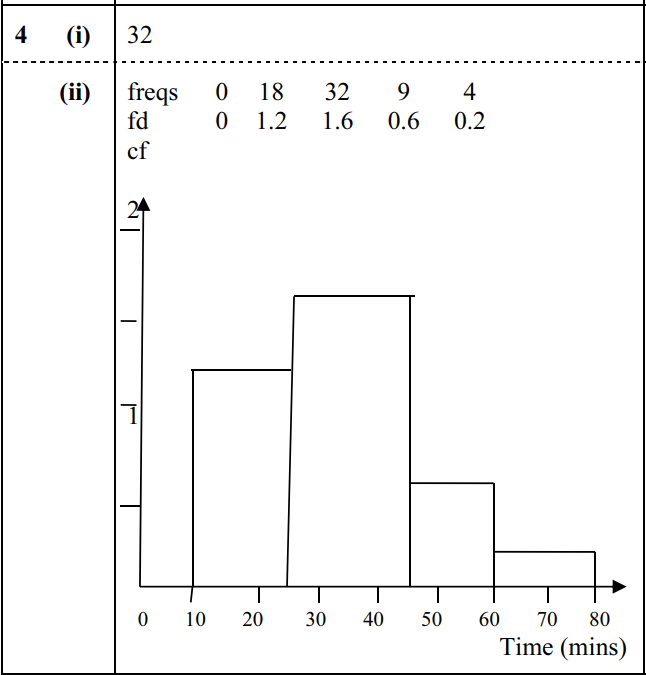
(i) State how many journey times were between 25 and 45 minutes. [1]
(ii) Draw a histogram on graph paper to represent the data. [4]
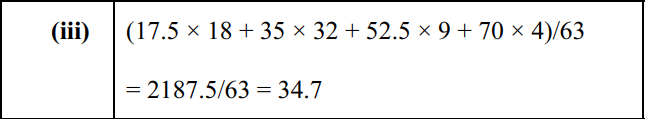
(iii) Calculate an estimate of the mean journey time. [2]
Answer/Explanation
Ans:
Question
Helen measures the lengths of 150 fish of a certain species in a large pond. These lengths, correct to the nearest centimetre, are summarised in the following table.
| Length(cm) | 0-9 | 10-14 | 15-19 | 20-30 |
| Frequency | 15 | 48 | 66 | 21 |
(a) Draw a cumulative frequency graph to illustrate the data.
(b) 40% of these fish have of d cm or more. Use your graph to estimate the value of d.
The mean length of these 150 fish is 15.295 cm.
(c) Calculate an estimate for the variance of the lengths of the fish.
Answer/Explanation
Ans:
(a) 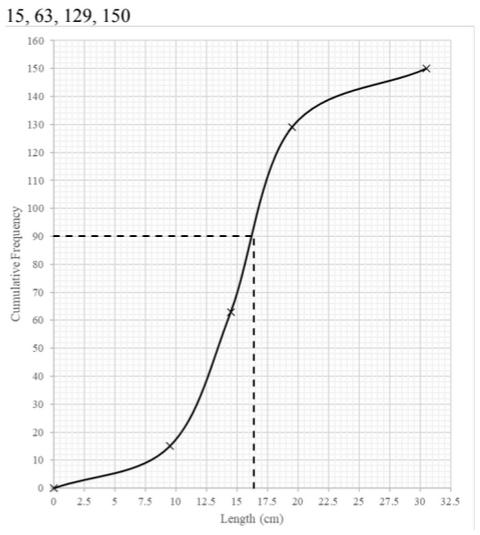
(b) 60% of 150 = 90
Approx. 16.5 [cm]
(c) Midpoints: 4.75, 12, 17, 25
Var = \(4.75^2 \times 15 + 12^2 \times 48 + 17^2 \times 66 + 25^2 \times 21}{150}-15.295^2\)
= 29.1
Question
The numbers of chocolate bars sold per day in a cinema over a period of 100 days are summarised in
the following table.
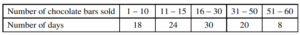
(a) Draw a histogram to represent this information. [5]
(b) What is the greatest possible value of the interquartile range for the data? [2]
(c) Calculate estimates of the mean and standard deviation of the number of chocolate bars sold. [4]
Answer/Explanation
Ans
7 (a) Class widths: 10, 5, 15, 20, 10
Frequency density = frequency/their class width: 1.8, 4.8, 2, 1, 0.8
All heights correct on diagram (using a linear scale)
Correct bar ends
Bar ends: 10.5, 15.5, 30.5, 50.5, 60.5
7 (b) 11 – 15 and 31 – 50 B1
Greatest IQR = 50 – 11 = 39
7 (c) \(Mean=\frac{18\times 5.5+24\times 13+30\times 23+20\times 40.5+8\times 55.5}{100}=\frac{2355}{100}=23.6\)
\(Var=\frac{18\times 5.5^{2}+24\times 13^{2}+30\times 23^{2}+20\times 40.5^{2}+8\times 55.5^{2}}{100}-mean^{2}\)
\(\frac{77917.5}{100}-mean^{2}=224.57\)
Standard deviation = 15.0
(FT their variance)
Question
The times, t minutes, taken by 150 students to complete a particular challenge are summarised in the
following cumulative frequency table.
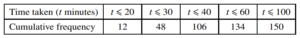
(a) Draw a cumulative frequency graph to illustrate the data. [2]
(b) 24% of the students take k minutes or longer to complete the challenge. Use your graph to
estimate the value of k. [2]
(c) Calculate estimates of the mean and the standard deviation of the time taken to complete the
challenge. [6]
Answer/Explanation
Ans
6 (a) 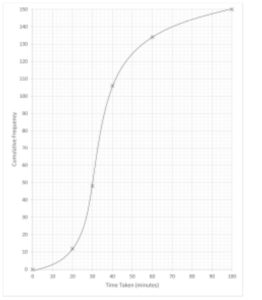
Correct cumulative frequency curve
6 (b) 150× 0·76 = 114
k = 45 (mins)
6 (c) Frequencies: 12 36 58 28 16
\(Mean=\frac{10\times 12 \times 25 \times 36\times 35\times 58 \times 50 \times 28\times 80\times 16}{150}\)
\(\frac{120 + 900 + 2030+ 1400 + 1280}{150}\)
\(38.2, 38\frac{1}{5}\)
\(Variance=\frac{12\times 10^{2}\times 36\times 25^{2}\times 58\times 35^{2}\times 28\times 50^{2}\times 16\times 80^{2}}{150}-mean^{2}\)
\(=\frac{1200 + 22500 + 71050 + 70000 + 102400}{150}-mean^{2}\)
(Standard deviation \(=\sqrt{321.76}=17.9\)