Question
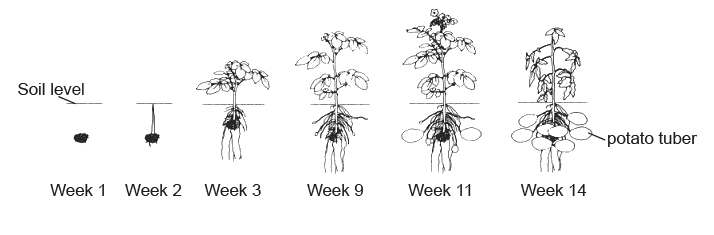
The diagram shows the development of potato plants (Solanum tuberosum) over 14 weeks. New tubers start growing from week 9. These are modified underground stems serving as a starch reserve and bearing buds from which new plants arise.
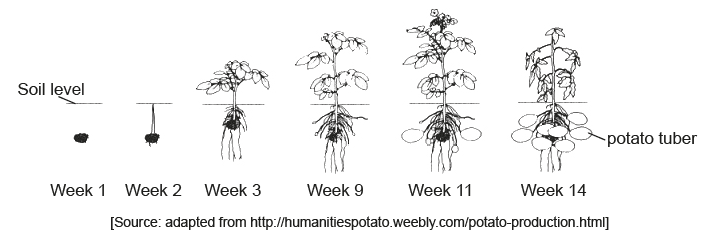
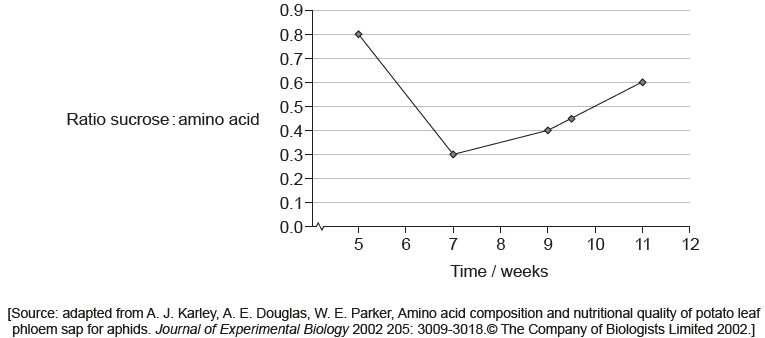
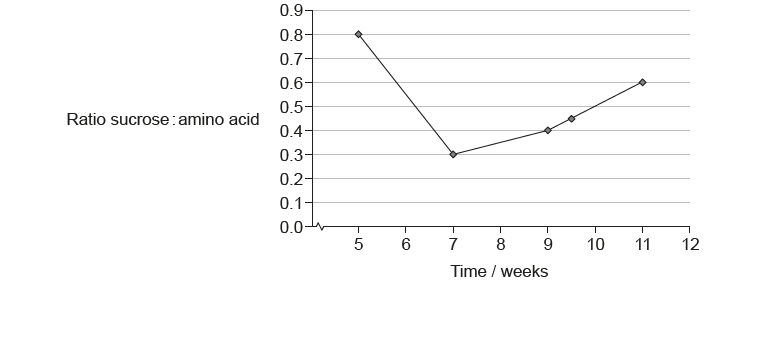
Scientists planted several potato plants in a greenhouse. The sucrose and amino acids in potato plant phloem exudates were measured during several weeks.
Describe briefly how scientists obtained leaf phloem sap from the potato plants.
Suggest reasons for different amounts of sucrose in the leaf phloem sap of the potato plants.
Answer/Explanation
Markscheme
a. aphids insert stylet in «potato» plants/feed from «potato» plants
“Aphids” is essential for the mark.
b. phloem exudates/sap obtained from severed stylets
“Stylets” is essential for the mark.
a. sucrose produced by leaves during photosynthesis
b. sucrose moves/translocates from source/leaves to sink/roots/tubers
OR
sucrose carried by phloem to tuber
c. «wk 5» high sucrose with increased leaf growth/photosynthesis / OWTTE
d. «wk 5-7» more sucrose used for general plant growth / OWTTE
e. «wk 7-11» concentration sucrose increases due to greater production/photosynthesis «than usage/storage» / OWTTE
f. sucrose transformed into starch in tuber «from week 9»
g. contribution of amino acids unknown so difficult to know about different amounts of sucrose / OWTTE
Award the mark for realizing that amino acids play a role in the ratio
h. «abiotic» conditions in greenhouse may vary over time / OWTTE
Accept abiotic factors only if variation through time is explicit.
Question
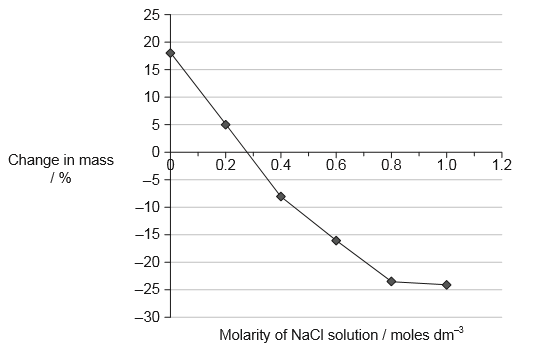
Solutions of ions, for example NaCl dissolved in water, can be used to investigate the concentration of solutes in plant tissues. After immersion in solutions of varying concentration, the percentage changes in mass of potato samples were measured. The graph shows the results.
(i) Estimate the osmolarity of the plant tissue.
…………………..moles dm–3
(ii) Identify which part of the graph represents samples measured in a hypotonic solution.
(iii) State one possible source of error when collecting data during this experiment.
Ions move across the plasma membrane of a neuron during an action potential. The oscilloscope trace shows voltage changes generated in a neuron during three action potentials.

Explain the movement of ions which causes the voltage changes observed during the interval labelled X on the graph.
Answer/Explanation
Markscheme
(i)
0.28 «moles dm–3» (Allow answers in the range of 0.27 to 0.29 «moles dm–3»)
0.56 «osmoles dm–3» (Allow answers in the range of 0.55 to 0.57 «osmoles dm–3»)
(ii)
«Any» part of the line above 0 percent change in mass (Allow ECF for upper value of molarity.)
0 to 0.28 molarity of NaCl solution
(iii)
Too few samples weighed
Not dried before weighing
Samples from different sources
Not cut all same way so different surface area
Temperature of each sample not the same
Potatoes not left for the same time in the solutions
Error due to the limitation of the apparatus/equipment
Differentiate between errors and mistakes eg: do not accept “balance read incorrectly”
Do not accept mass/weight differences
At the peak the sodium channels close
The potassium channels open
Potassium ions flow out
Repolarization occurs
Delay in closing of potassium channels
Hyperpolarization results
Sodium and potassium pump re-starts to restore ions to resting/previous potentials/concentrations
Accept Na+ and K+ ions
Award [2 max] if answer refers to part of graph before X
Examiners report
(i) and (ii): Most candidates could estimate the osmolarity of the plant tissue though fewer could identify the samples in hypotonic solution. Credit was given to candidates whose answers considered the dissociation of sodium chloride in water.
(iii) Candidates had difficulty differentiating between a source of error and a mistake through carelessness or improper technique.
Discriminated well with only good candidates scoring full marks. Many referred to ion movement before the interval labelled X on the graph.
Question
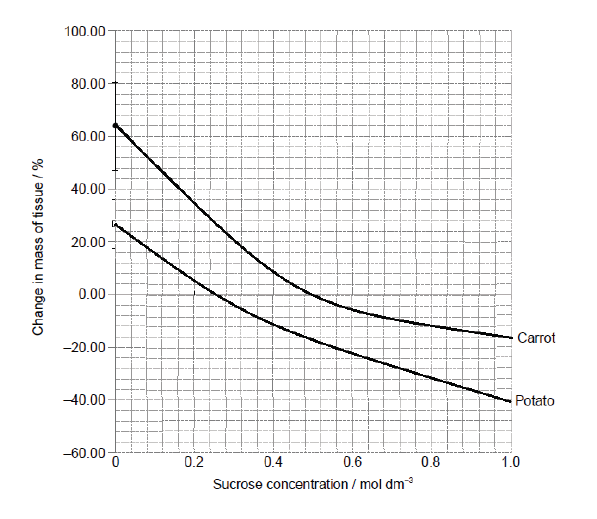
An experiment was carried out on osmosis in carrot (Daucus carota) root tissue and potato (Solanum tuberosum) tuber tissue. Similar sized pieces of tissue were cut and soaked in different sucrose solutions for 24 hours. The results are shown in the graph below.
a. Using the graph, estimate isotonic sucrose solutions for potato tissue and carrot tissue.[2]
Potato:
Carrot:
b. Suggest a reason for the difference in the isotonic points for the potato and the carrot tissues.[1]
c. From the evidence provided by the graph, evaluate the reliability of these data.[2]
d. Explain one reason for calculating the percentage change in mass.[2]
▶️Answer/Explanation
Ans:
a. potato: $0.26 \mathrm{~mol} \mathrm{dm}^{-3} \vee$ Allow a range of $0.22-0.32$
carrot: $0.50 \mathrm{~mol} \mathrm{dm}^{-3} \vee$ Allow a range of $0.45-0.55$ (Allow 1 max if no units or either unit is omitted)
b. different dissolved solutes/sugars/sucrose/salts/molarities
OR
may have been grown in different soils giving their tissues different contents
$O R$
may have been stored under different conditions ✔
OR
may be more dehydrated / different water content ✔
OR
different types of tissue / different age ✔
Do not accept starch.
a. the data show clear trends
OR
a trend line could be drawn through these data
OR
there are no outliers ✔
b. the error bars/standard deviations shown
OR
the error bars/standard deviations vary with concentration ✔
c. sample size is unknown ✔
d.
a. the change in mass indicates whether the tissue has gained/lost water ✔
b. the pieces of tissue will not be the same mass «at the beginning of the experiment» ✔
c. to compare the relative changes in mass ✔
Question
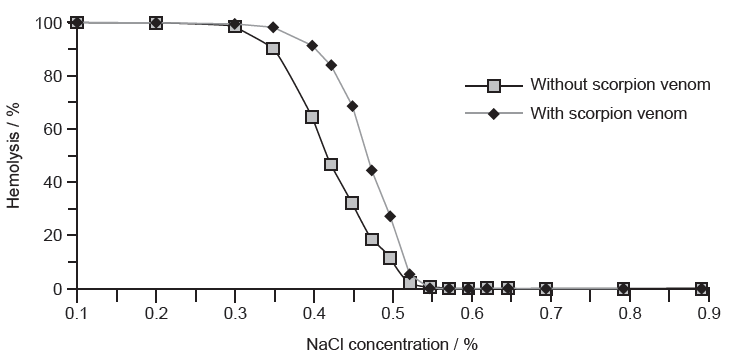
Data was collected on rabbit red blood cells that were exposed to sodium chloride (NaCl) and scorpion venom. Under some osmotic conditions red blood cells swell and burst, releasing hemoglobin (hemolysis). The graph shows the response of red blood cells to different concentrations of sodium chloride, with and without scorpion venom.
[Source: Adapted from Mirakabadi A Z, et al., (2006), J. Venom. Anim. Toxins incl. Trop. Dis., 12 (1), pages 67–77 (London: BioMed Central)]
a. Outline the effect of the venom on the hemolysis of red blood cells.[2]
b.Describe how the variables would be controlled in an experiment to estimate the osmolarity of plant tissue.
▶️Answer/Explanation
Ans:
a. a. in $\mathrm{NaCl}$ concentrations between 0.3 to $0.5 \%$ venom increases the percentage of hemolysis/more cells lyse
b. venom has no effect below $0.3 \%$ and above $0.55 \% \mathrm{NaCl}$
OR
Venom has no effect at very low or very high $\mathrm{NaCl}$ concentrations
b. a. weigh all pieces to ensure same amount of plant material/allow comparisons
b. control surface area by having same shape/ size
c. carry out experiment at same temperature e.g. using a water bath or constant room temperature
d. all samples in solution for same length of time
e. all samples from same plant (to minimize variability)
f. use a range of solutions of the same solute
g. constant method of removing excess fluid before weigh tissue samples
Do not accept just a list of controlled variables.
Question
An experiment was carried out to study osmosis in plant cells. Small cylinders of zucchini (Cucurbita pepo) were cut and placed in different sucrose solutions at 25 °C. The figure shows the percentage changes in mass after 24 hours.
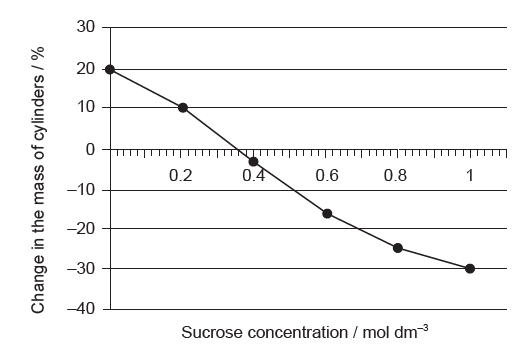
a. Estimate the solute concentration of the zucchini cells.[1]
b. If a zucchini is allowed to dry in the open air, predict how the osmolarity of the zucchini cells would change.
c. Explain one reason for calculating the percentage changes in mass.[2]
d. Predict what would happen to a red blood cell placed in distilled water.[1]
▶️Answer/Explanation
Ans:
a. $0.36 \mathrm{~mol} \mathrm{dm}^{-3} / \mathrm{M}$
Units required
Allow a range of $0.35-0.37 \mathrm{~mol} \mathrm{dm}^{-3} / \mathrm{M}$.
b. osmolarity will increase «because the cells become dehydrated»
OR
the cells become hypertonic
Accept water potential of the tissue decreases.
Do not accept “change” instead of “increase”.
c. a. the change in mass indicates whether the tissue has gained/lost water
b. the pieces of tissue will not all be the same mass «at the beginning of the experiment» $\checkmark$
c. to compare the relative changes in mass
d. a. water would move into the red blood cells
b. it would lyse
OR
swell
OR
burst
Question
An experiment was carried out to study osmosis in plant cells. Small cylinders of zucchini (Cucurbita pepo) were cut and placed in different sucrose solutions at 25 °C. The figure shows the percentage changes in mass after 24 hours.

a. Estimate the solute concentration of the zucchini cells.[1]
b. If a zucchini is allowed to dry in the open air, predict how the osmolarity of the zucchini cells would change.
c. Explain one reason for calculating the percentage changes in mass.[2]
d. Predict what would happen to a red blood cell placed in distilled water.
▶️Answer/Explanation
Ans:
a. $0.36 \mathrm{~mol} \mathrm{dm}^{-3} / \mathrm{M}$
Units required
Allow a range of $0.35-0.37 \mathrm{~mol} \mathrm{dm}^{-3} / \mathrm{M}$.
b. osmolarity will increase «because the cells become dehydrated»
OR
the cells become hypertonic
Accept water potential of the tissue decreases.
Do not accept “change” instead of “increase”.
c. a. the change in mass indicates whether the tissue has gained/lost water
b. the pieces of tissue will not all be the same mass «at the beginning of the experiment»
c. to compare the relative changes in mass
d. a. water would move into the red blood cells
b. it would lyse
OR
swell
OR
burst
Question
The diagram shows the development of potato plants (Solanum tuberosum) over 14 weeks. New tubers start growing from week 9. These are modified underground stems serving as a starch reserve and bearing buds from which new plants arise.
Scientists planted several potato plants in a greenhouse. The sucrose and amino acids in potato plant phloem exudates were measured during several weeks.
“Aphids” is essential for the mark.
“Stylets” is essential for the mark.
sucrose carried by phloem to tuber
Award the mark for realizing that amino acids play a role in the ratio
Accept abiotic factors only if variation through time is explicit.