| Date | November 2017 | Marks available | 2 | Reference code | 17N.3.SL.TZ0.13 |
| Level | Standard level | Paper | Paper 3 | Time zone | TZ0 |
| Command term | Construct | Question number | 13 | Adapted from | N/A |
Question
The sea snail Nucella ostrina and the sea star Pisaster ochraceus are predators of the mussel Mytilus trossulus. The mussels live on rocks at the edge of the sea and feed on phytoplankton and zooplankton. The zooplankton feed on the phytoplankton.

Groups of 50 mussels were transplanted to an experimental area and protected from predation until the start of the experiment. Researchers then investigated the effect of the predators on the population of the mussels over a period of 60 days.

[Source: Republished with permission of John Wiley and Sons, from Navarrete, S. A. and Menge, B. A. (1996),
Keystone Predation and Interaction Strength: Interactive Effects of Predators on Their Main Prey. Ecological Monographs, 66: 409–429. doi:10.2307/2963488; permission conveyed through Copyright Clearance Center, Inc.]
Compare and contrast the effects of the predators on the population of the mussels.
The sea star also eats the sea snails. Construct a food web to show the feeding relationships between these five organisms in the ecosystem.
Markscheme
a. both cause the frequency of the mussel to decrease
b. sea star affects the mussel population more than the sea snail
c. when both are together the effect of the sea snail is low
Accept binomial names
Allow numerical answers if expressed as comparisons and the candidates are not simply stating numbers
[Max 2 Marks]

Award [2] for a correct food web
Award [1] for phytoplankton, zooplankton and mussel with correct arrows
Award [1] for mussel, sea snail and sea star with correct arrows
Award [0] if arrows are in wrong direction
Accept binomial or scientific names
| Date | November 2017 | Marks available | 1 | Reference code | 17N.3.SL.TZ0.12 |
| Level | Standard level | Paper | Paper 3 | Time zone | TZ0 |
| Command term | Outline | Question number | 12 | Adapted from | N/A |
Question


Calculate the energy loss due to respiration in primary consumers in kJ m–2 y–1.
Outline why a year is more suitable than a month for the measurement of energy flow.
Explain how pesticides may undergo biomagnification in the lake.
Markscheme
190
accounts for different productivity at different times of year/seasonal variations
OR
more data collected
OR
to increase reliability
OR
trends over time more easily detected
a. the increase in concentration of the pesticide at higher trophic levels
b. taken in by organisms low in the food chain
c. cannot be excreted so remains in tissues
OR
accumulates as more organisms from lower levels are eaten
d. pesticides do not degrade/degrade very slowly
[Max 2 Marks]
| Date | May 2017 | Marks available | 3 | Reference code | 17M.3.SL.TZ2.17 |
| Level | Standard level | Paper | Paper 3 | Time zone | Time zone 2 |
| Command term | Discuss | Question number | 17 | Adapted from | N/A |
Question
The fire ant (Solenopsis geminata) is an effective colonizer and has become invasive in a number of ecosystems. Sometimes, efforts to eliminate this species have had an unexpected impact on community structure. It is argued that S. geminata can play a beneficial role in corn production. The graph shows how the presence of S. geminata
can impact insect diversity in areas where crops of corn are grown.

State the impact of S. geminata on insect species diversity.
Discuss whether S. geminata might play a positive role in corn production.
Researchers have argued that S. geminata is a keystone species in the corn agricultural system. Outline what is meant by a keystone species.
Markscheme
reduction in number of species/richness/diversity
a. biological control of/reduction in corn pests
b. reduction in the use of pesticides
c. damage on beneficial species OWTTE
d. reduction in insect diversity can have broad ecosystem negative impact
OR
example of negative effect
e. long-term effects unknown
definition
a. keystone species is one in which presence has a disproportionate impact on the ecosystem
impact
b. removal often leads to significant changes
OR
valid example
| Date | May 2017 | Marks available | 1 | Reference code | 17M.3.SL.TZ2.16 |
| Level | Standard level | Paper | Paper 3 | Time zone | Time zone 2 |
| Command term | Outline | Question number | 16 | Adapted from | N/A |
Question
The pyramid of biomass obtained from a pine forest stream includes the parasite biomass. Parasites are fungi, worms and other organisms that live on a host.

Estimate the approximate amount of biomass represented by parasites in this ecosystem.
Compare and contrast the biomass in the different trophic levels.
Outline the reason that parasite biomass occurs in both tertiary consumers and secondary consumers.
Markscheme
any value between 15 kg and 22 kg
a. biomass decreases going up the trophic levels ✓
b. autotrophs have greatest biomass «around 40 040 kg»
OR
tertiary consumers have the least biomass ✓
c. greatest loss of biomass is from autotrophs to primary consumers
parasites feed on secondary and primary consumers
| Date | May 2017 | Marks available | 2 | Reference code | 17M.3.SL.TZ1.14 |
| Level | Standard level | Paper | Paper 3 | Time zone | Time zone 1 |
| Command term | Predict | Question number | 14 | Adapted from | N/A |
Question
The Gersmehl diagram below shows the movement and storage of nutrients in a taiga ecosystem.

Predict the possible effect of global warming on the nutrient flow in a taiga ecosystem.
Markscheme
a. increased biomass «with higher temperatures»
b. «so» increased uptake of nutrients from soil «into the biomass»
c. increased decomposition of litter «due to growth of decomposers»
d. «so» increased nutrient composition of soil «L→ S»
e. increased weathering of rocks «increasing minerals in soil»
f. weather changes cause increased runoff from litter/leaching from soil
| Date | November 2016 | Marks available | 1 | Reference code | 16N.3.SL.TZ0.14 |
| Level | Standard level | Paper | Paper 3 | Time zone | TZ0 |
| Command term | Outline | Question number | 14 | Adapted from | N/A |
Question
In 1997 in South Africa, a decision was made to decrease the use of mosquito-killing pesticides due to their negative effect on the environment. Mosquitoes are known to be responsible for the spread of malaria. In 2001 the decision was reversed and the use of pesticides was increased. The graph shows the estimated numbers of people with malaria in each year.

Outline the trend in the number of people with malaria during the period when the use of pesticides was decreased in South Africa.
One pesticide used in killing mosquitoes was DDT. Considering its harmful effects, discuss whether the decision to reintroduce it was justified.
Markscheme
the number of people with malaria increased
a. choice has to be made between damage to environment or increase in malaria
b. DT may lead to biomagnification/bioaccumulation in food chains
OR
taken up by species in lower trophic levels becoming more concentrated at higher trophic levels
c. causes harm to consumers at end of food chain
OR
example «eg: thin egg shells of falcons»
d. DDT is shown to be effective in reducing malaria
e. possible partial solution to be selective in areas sprayed with DDT
f. may kill insects that are not pests
| Date | November 2016 | Marks available | 3 | Reference code | 16N.3.SL.TZ0.12 |
| Level | Standard level | Paper | Paper 3 | Time zone | TZ0 |
| Command term | Explain | Question number | 12 | Adapted from | N/A |
Question
The climograph shows the distribution of biomes according to the temperature and rainfall of land areas on Earth.

Identify the ecosystem with the appropriate numeral from the climograph.

Referring to the climograph, explain reasons that the nutrient store in the litter layer of the taiga is greater than in the tropical rainforest.
Markscheme

Award [2] if all three are correct, [1 max] if one or two are correct and [0] if none correct.
a. litter is dead plant material on the ground
b. conditions in tropical rainforests are ideal to decompose plant material
OR
conditions in taiga do not favour decomposition of litter
c. decomposition returns nutrients to soil
OR
nutrients in taiga remain in the litter and not in the soil
d. tropical rainforests have more saprotrophs/decomposers
OR
taiga have fewer saprotrophs/decomposers
Numbers alone do not constitute an explanation.
| Date | May 2015 | Marks available | 2 | Reference code | 15M.3.SL.TZ1.20 |
| Level | Standard level | Paper | Paper 3 | Time zone | Time zone 1 |
| Command term | Outline | Question number | 20 | Adapted from | N/A |
Question
The diagram below shows changing vegetation along a slope in a terrestrial ecosystem.

Describe how a transect can be used to investigate the distribution of plant species in this ecosystem.
The vegetation shown here has developed as a result of primary succession. Outline the changes that take place in the abiotic environment during primary succession.
Outline the abiotic factors that affect the distribution of plant species in an ecosystem.
Markscheme
a. random positioning of the transect;
b. transect is a line stretched over an area of study;
c. samples taken/species present recorded at regular intervals along the transect;
d. used to investigate effect of an abiotic variable/named example;
a. rocks begin to break down;
b. minerals begin to accumulate;
c. soil begins to develop;
d. water retention increases;
e. erosion of soil is reduced (by rhizoids and roots);
The question asks for an outline but most candidates have given a list of factors without a reason. Therefore award [1] for every two factors listed or [1] for each qualified factor.
water (distribution) for turgor/biochemical reactions/photosynthesis;
mineral / inorganic content / salinity of soil/water;
temperature (max, min, range, seasonal changes) / altitude;
light (intensity, duration, wavelength) for photosynthesis;
pH (range, average, changes) of soil/water;
wind (direction, strength);
| Date | May 2013 | Marks available | 1 | Reference code | 13M.3.SL.TZ1.19 |
| Level | Standard level | Paper | Paper 3 | Time zone | Time zone 1 |
| Command term | State | Question number | 19 | Adapted from | N/A |
Question
Scientists studied the characteristics of plant species growing in front of the progressively receding Rutor glacier in Italy. As the ice recedes plants are able to colonize the exposed ground. In a study of primary succession, scientists sampled plants from three areas exposed during different time periods. The data is shown in the following triangle graph.
Each species is represented by a number and positioned according to its degree of competitiveness (the ability to exclude other species), stress-tolerance (the ability to use nutrients efficiently) and ruderalism (the ability to develop rapidly to avoid disturbance).
Stages of succession were classified according to the time the ground had been exposed: early succession (species occurring in ground exposed for less than 68 years), mid-succession (species found in ground exposed between 69 and 181 years) and late-succession (species found in ground exposed for more than 181 years).

State the most ruderal species.
Species number 4 has a ruderalism value of 29. State the stress-tolerance value and competitiveness value of this species.
Stress-tolerance value: ………………….
Competitiveness value: ………………….
Analyse the change of species over time.
Markscheme
early succession species/examples of species /(numerical species numbers)/9
stress-tolerance value: 34 (Accept answers between 33 and 35)
competitiveness value: 38 (Accept answers between 37 and 39)
a. high ruderalism and (slightly higher) competitiveness in early succession;
b. (as time goes / succession stages advance) stress-tolerance increases;
c. competitiveness decreases;
d. ruderalism decreases/is more variable;
e. competitiveness least important factor / stress-tolerance most important factor;
f. exceptions for all categories;
| Date | November 2013 | Marks available | 1 | Reference code | 13N.3.SL.TZ0.19 |
| Level | Standard level | Paper | Paper 3 | Time zone | TZ0 |
| Command term | Analyse | Question number | 19 | Adapted from | N/A |
Question
The relative abundance of different grass species in the 17 plant communities of the Serengeti ecosystem in Tanzania is presented in the graph below. The communities are listed along a transect that runs from the dry south-eastern boundary of the park (community 1), north and west across the plains and woodlands to Lake Victoria (community 17).
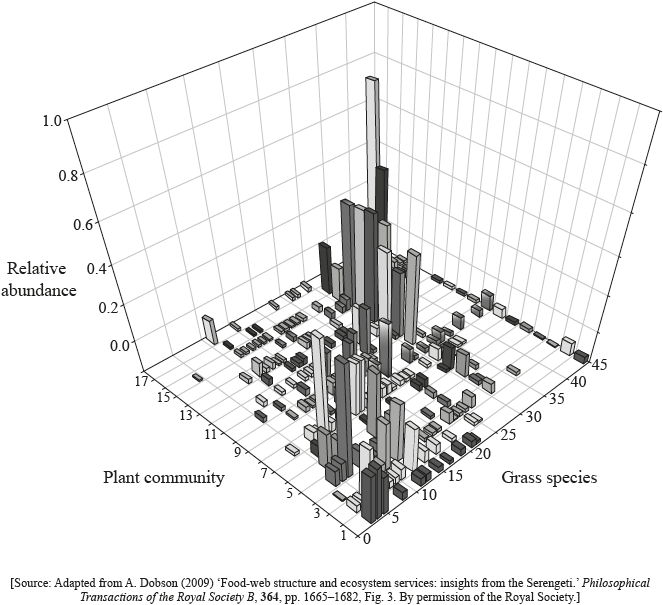
Both communities 1 and 17 have a low overall abundance of grasses.
State the grass species that is most abundant in plant community 1.
Analyse the graph to find whether species 45 has a broad or narrow realized niche.
Suggest a reason for this in community 1.
Suggest a reason for this in community 17.
Evaluate the conclusion that there are trends in the distribution of plants along the transect of Serengeti grass communities.
Markscheme
4
broad (realized niche as present in many communities)
lack of water
shading from trees / lack of light /competition from trees and shrubs
communities have different species present;
grass species 1 to 15 more common in communities 1 to 7/dry south east boundary; (accept values within 3 of the upper and lower values given in the marking point)
grass species 32 to 45 more common in communities 13 to 17/woodlands; (accept values within 3 of the upper and lower values given in the marking point)
pattern linked to variation in rainfall/abiotic factors;
appears to have clusters of distinct plant species with little overlap;
species are found in certain areas only;
| Date | May 2012 | Marks available | 2 | Reference code | 12M.3.SL.TZ2.20 |
| Level | Standard level | Paper | Paper 3 | Time zone | Time zone 2 |
| Command term | Construct | Question number | 20 | Adapted from | N/A |
Question
Biotic factors involve the other organisms in the environment of an animal species. List two biotic factors that could affect the distribution of an animal species.
1. …………………………………………………………
2. …………………………………………………………
Research into a river ecosystem produced these approximate values: 25, 300, 6000 and 36 000 kJ m–2 yr–1. Using this data, construct a pyramid of energy showing four named trophic levels, each with their corresponding energy value.
Markscheme
predation;
competition;
disease;
food supply;

bars of decreasing size going upwards at least a third of the bar below;
the trophic level on each bar labelled correctly;
| Date | November 2010 | Marks available | 3 | Reference code | 10N.3.SL.TZ0.3 |
| Level | Standard level | Paper | Paper 3 | Time zone | TZ0 |
| Command term | Label | Question number | 3 | Adapted from | N/A |
Question
Label the levels of the trophic pyramid of energy shown below.

Markscheme
X: tertiary consumers;
Y: secondary consumers;
Z: producers;