Question:
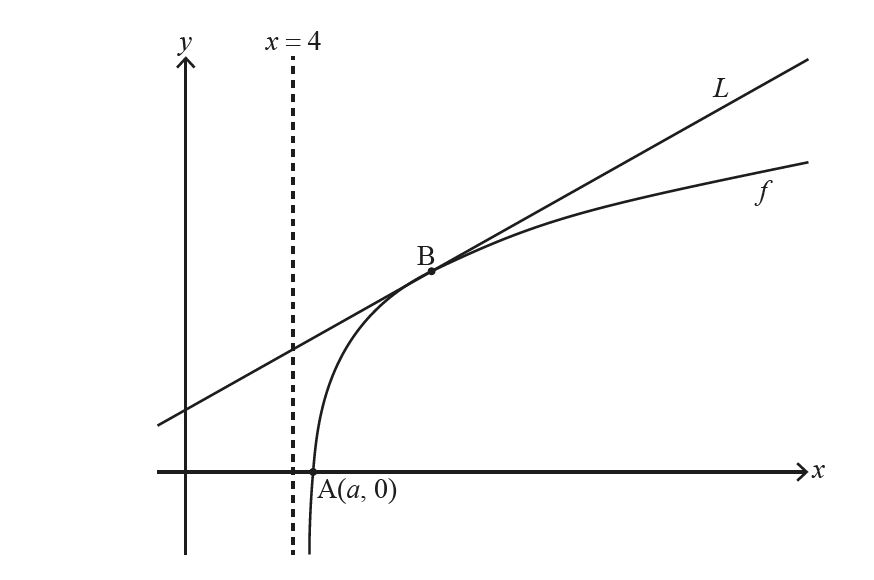
Consider the function f defined by f (x) = ln (x2 – 16) for x > 4 .
The following diagram shows part of the graph of f which crosses the x-axis at point A, with
coordinates ( a , 0 ). The line L is the tangent to the graph of f at the point B.
(a) Find the exact value of a . [3]
▶️Answer/Explanation
Ans: When f(x)=0, we have
ln(x2−16)=0
x2−16=1
x=±√17
However, since x>4, we have x=√17
(b) Given that the gradient of L is \(\frac{1}{3}\) , find the x-coordinate of B. [6]
▶️Answer/Explanation
Ans: Differentiating f(x) with respect to x, we have f′(x)= \(\frac{2x}{x^2-16}\)
At B, f′(x)=\(\frac{1}{3}\) , i.e., we have
x2−16=6x
x2−6x−16=0
(x+2)(x−8)=0.
Thus, x=−2 (reject) or x=8.
Question
The graph of \(y = \frac{{a + x}}{{b + cx}}\) is drawn below.
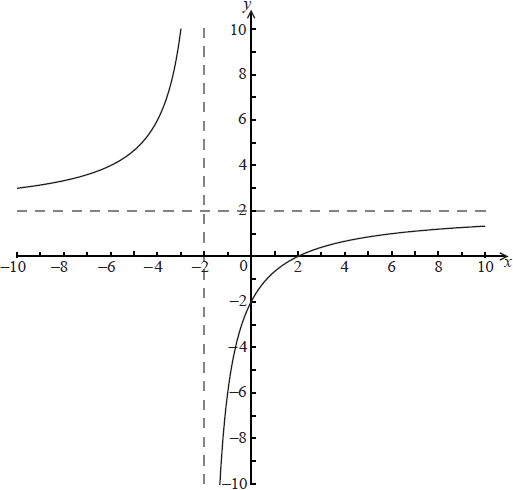
(a) Find the value of a, the value of b and the value of c.
▶️Answer/Explanation
Ans: an attempt to use either asymptotes or intercepts (M1)
\(a = – 2,{\text{ }}b = 1,{\text{ }}c = \frac{1}{2}\) A1A1A1
▶️Answer/Explanation
Ans: 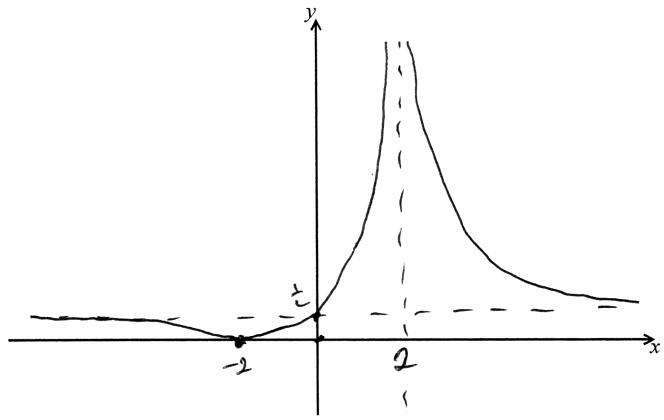
A4
Note: Award A1 for both asymptotes,
A1 for both intercepts,
A1, A1 for the shape of each branch, ignoring shape at \((x = – 2)\).
[8 marks]
Question
Let \(f(x) = {x^3} + a{x^2} + bx + c\) , where a , b , \(c \in \mathbb{Z}\) . The diagram shows the graph of y = f(x) .
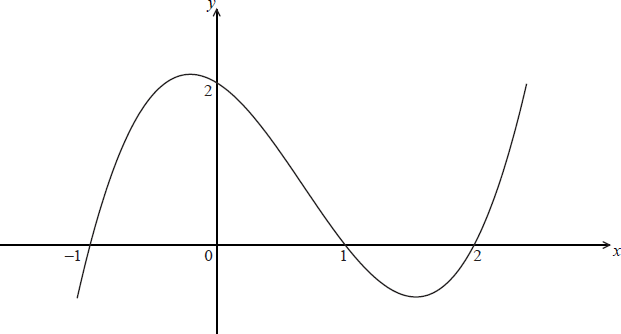
a.Using the information shown in the diagram, find the values of a , b and c .[4]
▶️Answer/Explanation
Ans: METHOD 1
f(x) = (x + 1)(x − 1)(x − 2) M1
\( = {x^3} – 2{x^2} – x + 2\) A1A1A1
a = −2 , b = −1 and c = 2
METHOD 2
from the graph or using f(0) = 2
c = 2 A1
setting up linear equations using f(1) = 0 and f(–1) = 0 (or f(2) = 0) M1
obtain a = −2 , b = −1 A1A1
[4 marks]
(i) state the coordinates of the points where the graph of g intercepts the x-axis.
(ii) Find the y-intercept of the graph of g .[3]
▶️Answer/Explanation
Ans:
(i) (1, 0) , (3, 0) and (4, 0) A1
(ii) g(0) occurs at 3f(−2) (M1)
= −36 A1
[3 marks]
Question
The diagram below shows a sketch of the graph of \(y = f(x)\).
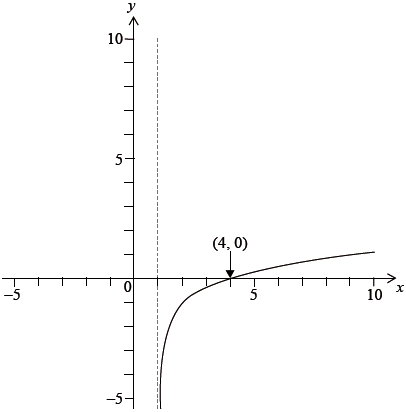
a. Sketch the graph of \(y = {f^{ – 1}}(x)\) on the same axes.[2]
▶️Answer/Explanation
Ans: 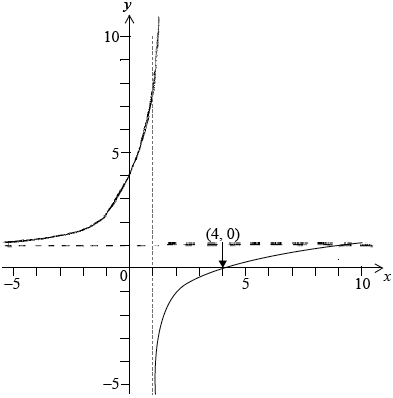
shape with y-axis intercept (0, 4) A1
Note: Accept curve with an asymptote at \(x = 1\) suggested.
correct asymptote \(y = 1\) A1
[2 marks]
▶️Answer/Explanation
Ans: range is \({f^{ – 1}}(x) > 1{\text{ (or }}\left] {1,{\text{ }}\infty } \right[)\) A1
Note: Also accept \(\left] {1,{\text{ 10}}} \right]\) or \(\left] {1,{\text{ 10}}} \right[\).
Note: Do not allow follow through from incorrect asymptote in (a).
[1 mark]
▶️Answer/Explanation
Ans: \((4,{\text{ }}0) \Rightarrow \ln (4a + b) = 0\) M1
\( \Rightarrow 4a + b = 1\) A1
asymptote at \(x = 1 \Rightarrow a + b = 0\) M1
\( \Rightarrow a = \frac{1}{3},{\text{ }}b = – \frac{1}{3}\) A1
[4 marks]