IB PHYSICS HL(Higher level) – 2024 – Practice Questions- All Topics
Topic 9.2 Single slit diffraction
Topic 9 Weightage : 5 %
All Questions for Topic 9.2 – The nature of single-slit diffraction
Question
The diagram shows the diffraction pattern for light passing through a single slit.
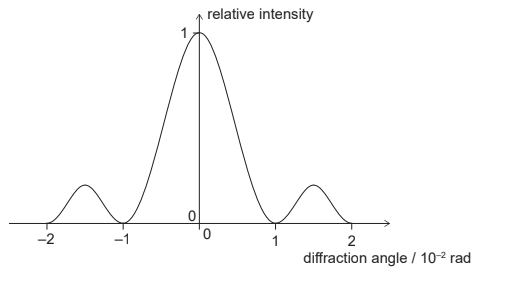
What is \(\frac{\text{wavelength of light}}{\text{width of slit}}\)
A 0.01
B. 0.02
C 1
D 2
▶️Answer/Explanation
Ans: A
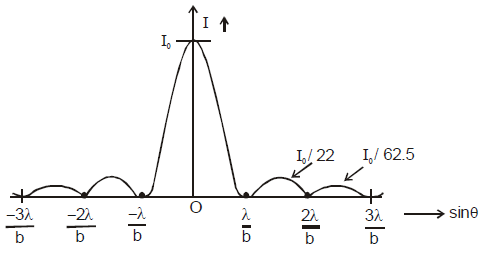
- The width of the central maxima is
 and angular width of central maxima is
 .
.
Hence \(\frac{\lambda}{b}=\) diffraction angle \(\theta\)
Hence as per given value in graph
\(\frac{\lambda}{b}= 10^{-2} = 0.001\)
Question
A beam of monochromatic light is incident on a single slit and a diffraction pattern forms on the screen.

What change will increase θs?
A. Increase the width of the slit
B. Decrease the width of the slit
C. Increase the distance between the slit and the screen
D. Decrease the distance between the slit and the screen
▶️Answer/Explanation
Markscheme
B
FRAUNHOFER DIFFRACTION BY SINGLE SLIT
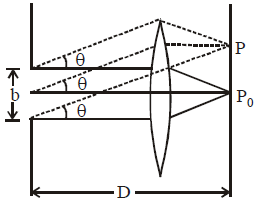
\(\therefore b \downarrow \Rightarrow sin\theta \uparrow\)
Question
A single-slit diffraction experiment is performed using light of different colours. The width of the central peak in the diffraction pattern is measured for each colour. What is the order of the colours that corresponds to increasing widths of the central peak?
A. red, green, blue
B. red, blue, green
C. blue, green, red
D. green, blue, red
▶️Answer/Explanation
Markscheme
C

- The width of the central maxima is
 and angular width of central maxima is
 .
.
Hence width of the central maxima increases with increase in wavelength.
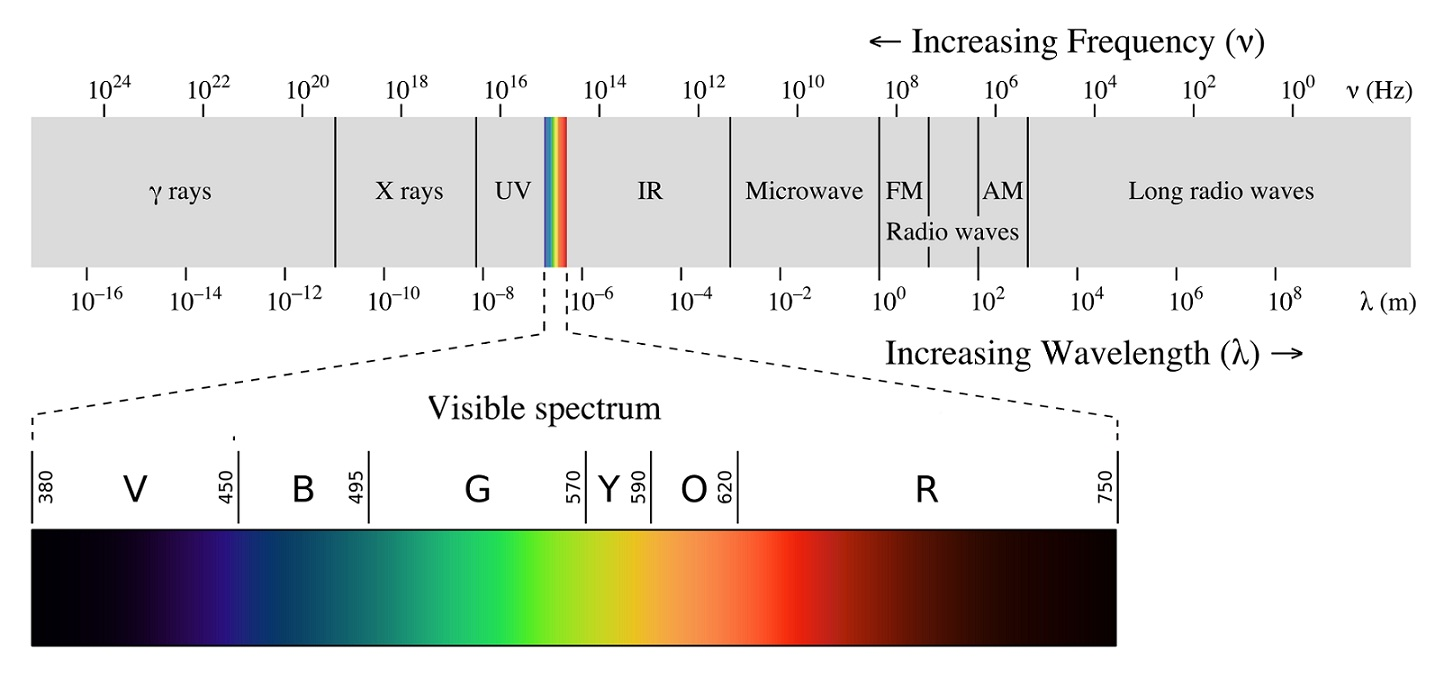
We can see lowest wavelength is blue and highest for red for blue, green, red
Question
A parallel beam of coherent light of wavelength λ is incident on a rectangular slit of width d. After passing through the slit the light is incident on a screen a distance D from the slit where D is much greater than d. What is the width of the central maximum of the diffraction pattern as measured on the screen?
A. \(\frac{{2D\lambda }}{d}\)
B. \(\frac{{2d}}{{D\lambda }}\)
C. \(\frac{{D\lambda }}{d}\)
D. \(\frac{d}{{D\lambda }}\)
▶️Answer/Explanation
Markscheme
A

- The width of the central maxima is
 and angular width of central maxima is
 .
.
Question
The intensity distribution of monochromatic light passing through a narrow slit and then incident on a screen is shown below.
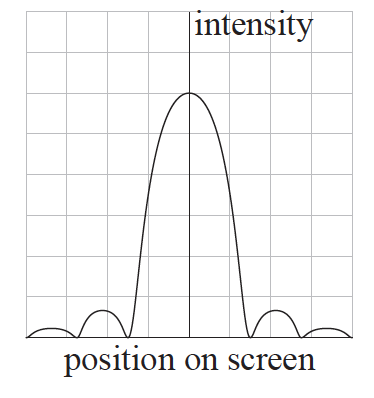
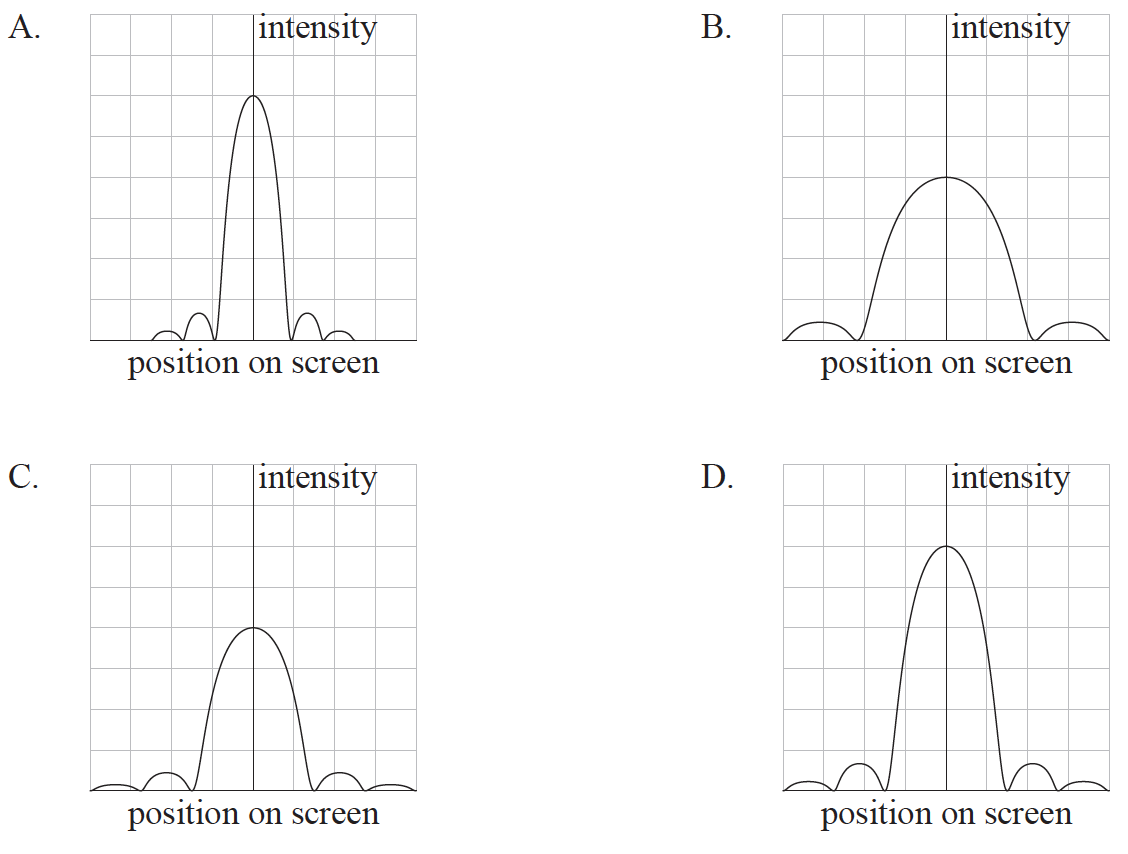
When the slit width is reduced which diagram shows the new intensity distribution? Diagrams are drawn to the same scale as the original.
▶️Answer/Explanation
Markscheme
B
The width of the central maxima is ![]() .
.
When b is reduced width of the central maxima is is increased .