| Date | November 2017 | Marks available | 2 | Reference code | 17N.3.SL.TZ0.16 |
| Level | Standard level | Paper | Paper 3 | Time zone | TZ0 |
| Command term | Outline | Question number | 16 | Adapted from | N/A |
Question
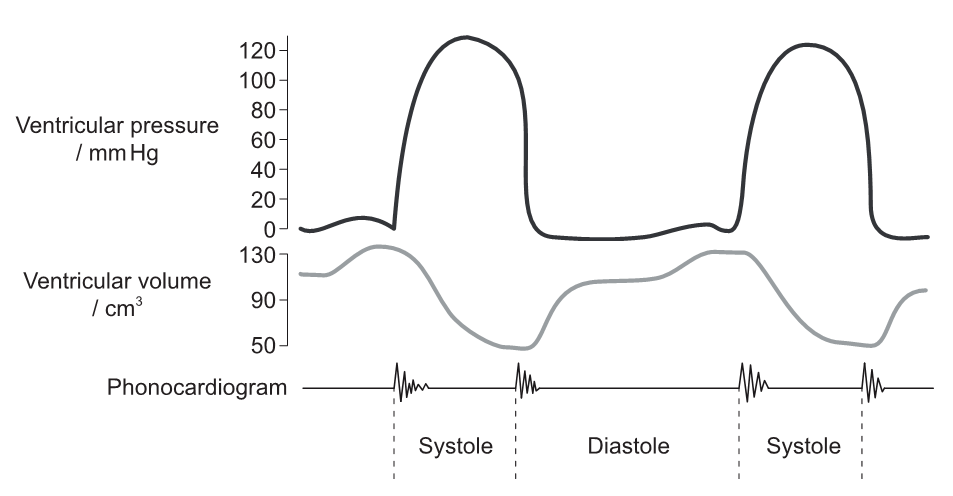
The diagram shows changes in the pressure and volume of the left ventricle during normal heartbeat. The phonocardiogram records heart sounds during the cardiac cycle.
[Source: Wiggers, Carl J. 1923. Modern Aspects of the Circulation in Health and Disease, 2nd ed. Philadelphia: Lea & Febiger, p. 97.]
State the relationship between pressure and volume in the left ventricle.
Explain the events that cause the sound shown on the phonocardiogram at the start of systole.
Outline reasons for fitting an artificial cardiac pacemaker.
Markscheme
as pressure increases volume decreases
OR
inverse correlation
Accept reverse argument
Do not accept “inversely proportional”
a. when the ventricle contracts blood presses/pressure acts on the AV valve
b. this closes the AV valve «which causes the sound»
The valve must be identified as the AV or atrioventricular valve
a. required when rate of heartbeat/heart contraction is too slow/irregular
b. produces electrical impulse that stimulates heartbeat/heart contraction
c. needed when SA node is defective
Accept “regulate the heartbeat” for marking point a
[Max 2 Marks]
| Date | May 2017 | Marks available | 2 | Reference code | 17M.3.SL.TZ2.21 |
| Level | Standard level | Paper | Paper 3 | Time zone | Time zone 2 |
| Command term | Label | Question number | 21 | Adapted from | N/A |
Question
The diagram shows the use of a sphygmomanometer in the measurement of blood pressure.
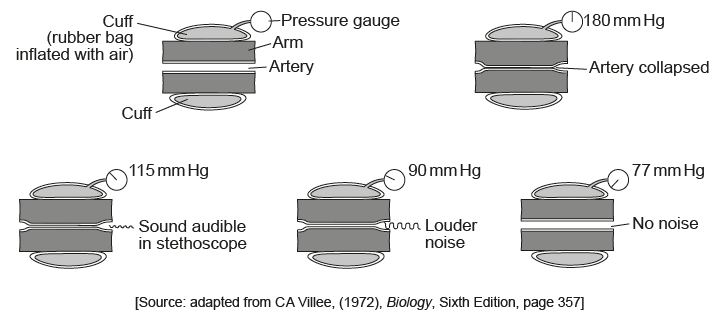
Identify the systolic pressure and diastolic pressure for this adult male.
Systolic pressure (mm Hg):
Diastolic pressure (mm Hg):
Explain the meaning of systolic and diastolic pressure.
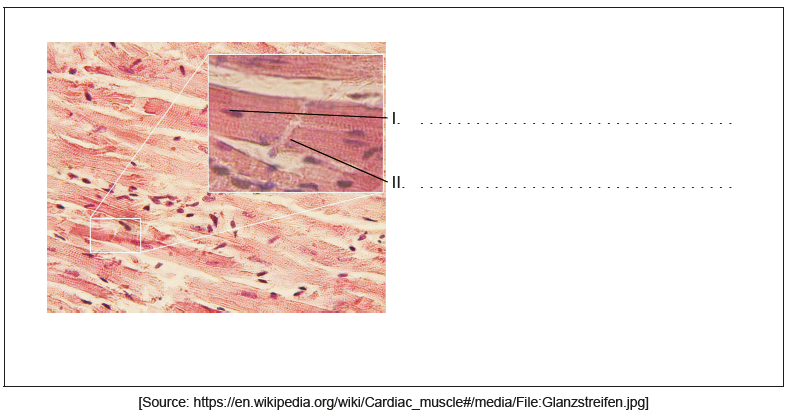
The photomicrograph shows cardiac muscle. Label the structures I and II.
Markscheme
systolic: 115
diastolic: 77 «mmHg»
Both needed for the mark.
a. «systolic/diastolic» pressure is the force of blood on arteries
b. systolic pressure is measured when the ventricle contracts
OR
systolic pressure is when blood is being pumped out of the heart
c. diastolic pressure is measured when the ventricles are filled with blood
OR
heart is at rest/relaxed
I: nucleus
II: intercalated disc
| Date | May 2017 | Marks available | 2 | Reference code | 17M.3.SL.TZ1.20 |
| Level | Standard level | Paper | Paper 3 | Time zone | Time zone 1 |
| Command term | Outline | Question number | 20 | Adapted from | N/A |
Question
The graph below shows a normal electrocardiogram (ECG) trace.
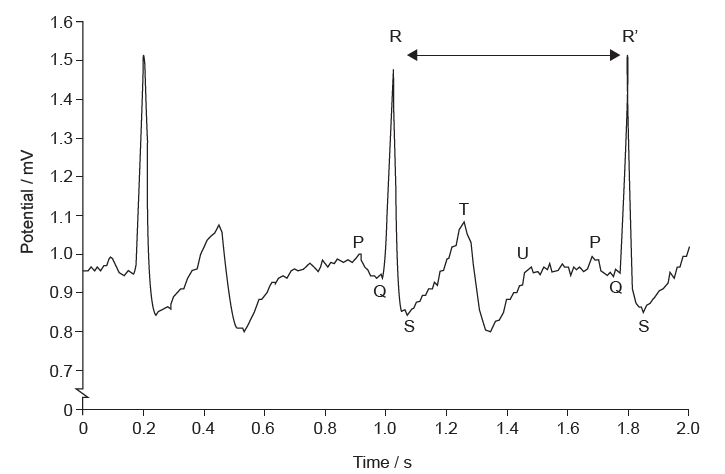
Using the letters provided, identify the parts of the ECG where the ventricle muscles are contracting.
State what is represented by the period between the points R and R’.
Outline the use of artificial pacemakers for patients with a heart condition.
Markscheme
QRS/ Q to S
one cardiac cycle
a. artificial pacemakers deliver electrical impulses «to heart muscle»
b. they maintain a regular heart rate / supplement the natural pacemaker
c. they sense missing heart beats and stimulate the heart
OR
correct malfunction of SAN / sinoatrial node
d. they coordinate contractions of atria and ventricles / left and right atria
| Date | November 2016 | Marks available | 1 | Reference code | 16N.3.SL.TZ0.15 |
| Level | Standard level | Paper | Paper 3 | Time zone | TZ0 |
| Command term | State | Question number | 15 | Adapted from | N/A |
Question
The QT interval corresponds to the time it takes for the ventricles of the heart to contract and then start to refill with blood before beginning the next contraction. Measures of QT interval were taken from 15-year-old female patients with anorexia nervosa and compared to healthy females of the same age. The body mass, heart rate and the mass of the left ventricle were also measured and the mean values are shown in the table.
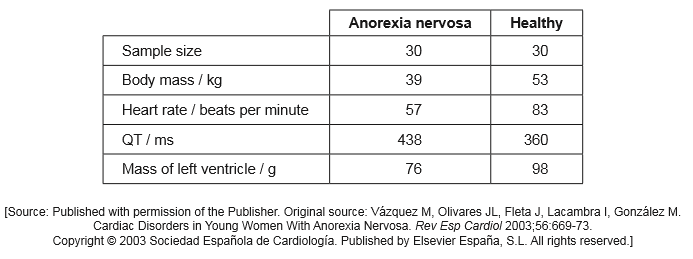
Outline the reasons that the female patients with anorexia nervosa have a lower mean ventricle mass than healthy females.
Suggest a reason for the difference in QT interval between females with anorexia nervosa and healthy females.
State the two causes of normal heart sounds.
Markscheme
a. patients with anorexia nervosa do not eat sufficient food/protein/amino acids. Starving = insufficient food
b. heart muscles used as an energy source
c. reduced body mass reduces requirement for muscle mass in ventricle
decreased left ventricle mass/pressure therefore more time needed to contract
atriaventricular/AV valve closing and semilunar/SV valves closing
Both valves need to be addressed for the mark.
| Date | May 2016 | Marks available | 4 | Reference code | 16M.3.SL.TZ0.20 |
| Level | Standard level | Paper | Paper 3 | Time zone | TZ0 |
| Command term | Explain | Question number | 20 | Adapted from | N/A |
Question
The incidence of coronary heart disease (CHD) was investigated among 14 000 people. Baseline measurements of the waist to hip ratio and body mass index (BMI) were collected from the participants. After six years, evidence of CHD was identified in follow-up interviews. The bar chart shows the results for the men only.
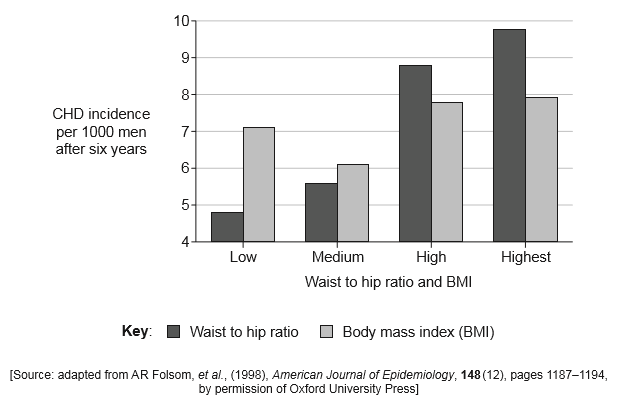
Deduce with a reason whether the waist to hip ratio or the BMI most clearly correlates to incidence of CHD.
Explain how electrical signalling in the heart leads to ventricular contraction
Markscheme
Waist to hip ratio as increasing ratio shows increasing CHD incidence/increasing BMI does not
Reason required
Cardiac muscle transmits electrical signals
OR
cardiac muscle is myogenic
SA node initiates signal
Signal spreads over atria
Reaches the AV node
Signal passes through bundle of His/Purkinje fibres
Signal delayed at AV node/bundle of His
Delay allows ventricles to fill «as atria contract»
Conducting fibers spread signal across ventricle walls
Ventricles contract
| Date | November 2012 | Marks available | 1 | Reference code | 12N.3.SL.TZ0.4 |
| Level | Standard level | Paper | Paper 3 | Time zone | TZ0 |
| Command term | Estimate | Question number | 4 | Adapted from | N/A |
Question
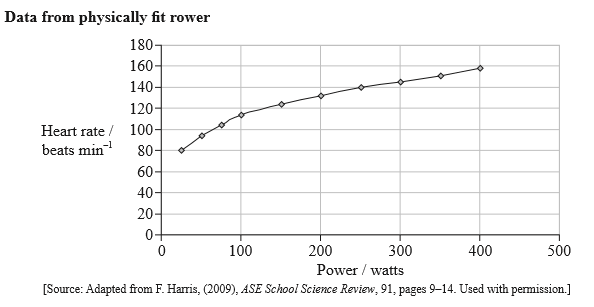
The data in the graph was obtained from a physically fit rower using a calibrated rowing machine and a heart rate monitor.
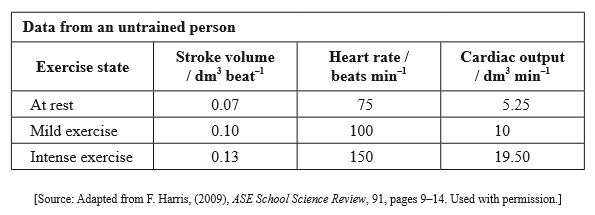
The table shows cardiac output during exercise for an untrained person.
Estimate, using the graph, the resting heart rate of the physically fit rower.
Estimate, using the graph, the increase in heart rate between exercise at 25 watts and 250 watts. (Show your workings.)
Predict, with a reason, whether the increase would be greater or less in an untrained person when the power output increases from 25 watts to 250 watts.
Markscheme
60 (beats min–1) (accept answers in the range of 58 to 64 (beats min–1))
(heart) rate 80 (at 25 W) and (heart) rate 140 (at 250 W) (difference =)
60 (beats min–1) (both needed)
greater as trained rower should have larger stroke volume / each (heart) beat more efficient / OWTTE (accept converse)