An apparatus is used to verify a gas law. The glass jar contains a fixed volume of air. Measurements can be taken using the thermometer and the pressure gauge.
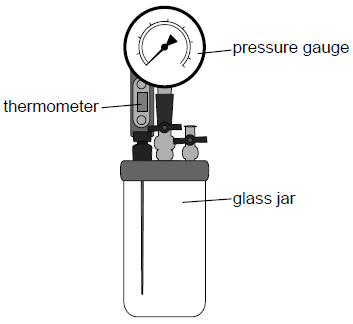
The apparatus is cooled in a freezer and then placed in a water bath so that the temperature of the gas increases slowly. The pressure and temperature of the gas are recorded.
a. The graph shows the data recorded.
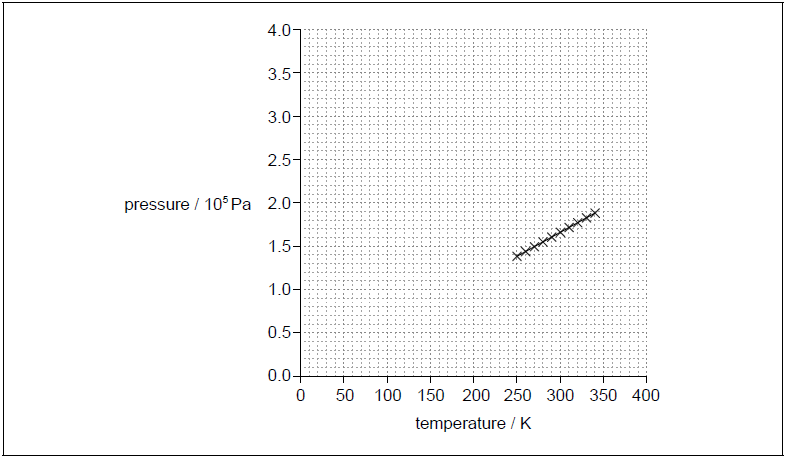
Identify the fundamental SI unit for the gradient of the pressure–temperature graph.[1]
(i) Using the axes provided in (a), draw the expected graph for this second experiment.
(ii) Explain the shape and intercept of the graph you drew in (b)(i).[3]
▶️Answer/Explanation
Markscheme
a. kg m–1 s–2 K–1
i any straight line that either goes or would go, if extended, through the origin
ii
for ideal gas p is proportional to T / P= nRT/V
gradient is constant /graph is a straight line
line passes through origin / 0,0
Question
The equipment shown in the diagram was used by a student to investigate the variation with volume, of the pressure p of air, at constant temperature. The air was trapped in a tube of constant cross-sectional area above a column of oil.
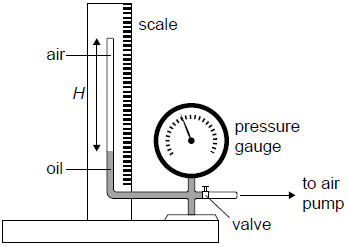
The pump forces oil to move up the tube decreasing the volume of the trapped air.
a. The student measured the height H of the air column and the corresponding air pressure p. After each reduction in the volume the student waited for some time before measuring the pressure. Outline why this was necessary.[1]
The following graph of p versus \(\frac{1}{H}\) was obtained. Error bars were negligibly small.
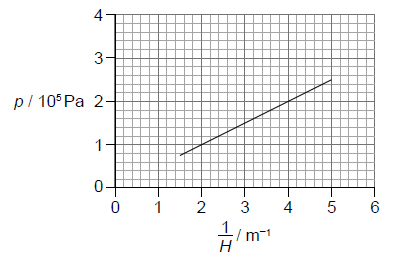
The equation of the line of best fit is \(p = a + \frac{b}{H}\).
Determine the value of b including an appropriate unit.[3]
▶️Answer/Explanation
Markscheme
a. in order to keep the temperature constant
in order to allow the system to reach thermal equilibrium with the surroundings/OWTTE
Accept answers in terms of pressure or volume changes only if clearly related to reaching thermal equilibrium with the surroundings.[1 mark]
recognizes b as gradient
calculates b in range 4.7 × 10⁴ to 5.3 × 10⁴ Pa\(\,\)m Award [2 max] if POT error in b.
Allow any correct SI unit, eg kg\(\,\)s–2.[3 marks]
\(V \propto H\) thus ideal gas law gives \(p \propto \frac{1}{H}\)
so graph should be «a straight line through origin,» as observed[2 marks]
\(n = \frac{{bA}}{{RT}}\) OR correct substitution of one point from the graph
\(n = \frac{{5 \times {{10}^4} \times 1.3 \times {{10}^{ – 3}}}}{{8.31 \times 300}} = 0.026 \approx 0.03\)
Answer must be to 1 or 2 SF.
Allow ECF from (b).[2 marks]
very large \(\frac{1}{H}\) means very small volumes / very high pressures
at very small volumes the ideal gas does not apply
OR
at very small volumes some of the assumptions of the kinetic theory of gases do not hold [2 marks]