Question
a) The box-and-whisker plot shows information about the marks scored by some students in a test.

(i) Write down the median mark. ………………………………………….
(ii) Work out the range.
………………………………………….
(iii) Jais scored a mark in the test that was higher than the marks scored by 75% of the students.
Write down a possible mark for Jais. ………………………………………….
(iv) This box-and-whisker plot shows information about the marks scored by the same students in
a second test.

Make one comparison between the distributions of marks in the two tests.
……………………………………………………………………………………………………………………………
……………………………………………………………………………………………………………………………
(b) The table shows information about the height, h cm, of each of 50 plants.
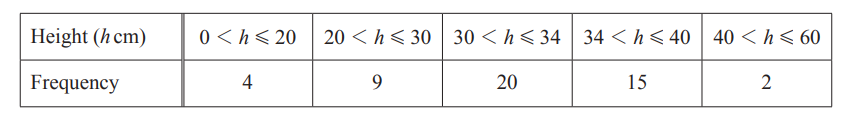
Calculate an estimate of the mean.
…………………………………….. cm
(c) Some apples are weighed and the mass, m grams, of each apple is recorded.
The table shows the results.
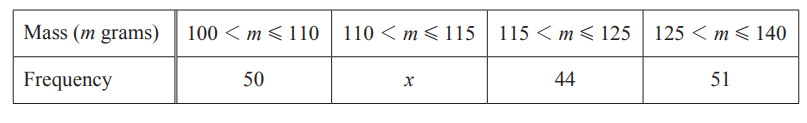
The histogram shows some of the information from the table.

(i) Work out the value of x.
x = …………………………………………
(ii) Complete the histogram.
Answer/Explanation
(a)(i) 70
(ii) 78
(iii) Value in range 86 <V ≤ 90
(iv) One general comment interpreting
the median comparison nfww
e.g. Students did better on second test
oe
OR
One general comment interpreting
IQR/range comparison nfww
e.g. Students marks were more
consistent on the 2nd test oe
(b) 31.2
(c)(i) 38
(ii) Blocks of heights 4.4 and 3.4 with
correct widths
Question
The heights, h metres, of the 120 boys in an athletics club are recorded.
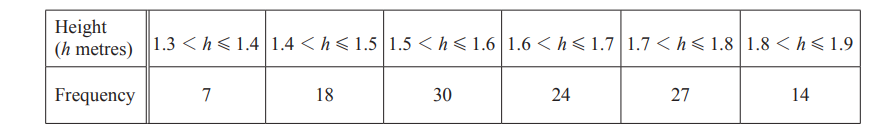
The table shows information about the heights of the boys.
(a) (i) Write down the modal class.
……………… \(\leq h < ………………\)
(ii) Calculate an estimate of the mean height.
……………………………………… m
(b) (i) One boy is chosen at random from the club.
Find the probability that this boy has a height greater than 1.8m.
………………………………………….
(ii) Three boys are chosen at random from the club.
Calculate the probability that one of the boys has a height greater than 1.8m and the other
two boys each have a height of 1.4m or less.
………………………………………….
(c) (i) Use the frequency table on page 4 to complete the cumulative frequency table.

(ii) On the grid, draw a cumulative frequency diagram to show this information.

(d) Use your diagram to find an estimate for
(i) the median height,
……………………………………… m
(ii) the 40th percentile.
……………………………………… m
Answer/Explanation
(a)(i)To determine the modal class, we need to identify the class interval with the highest frequency that is 1.5 < h ⩽ 1.6
(ii) 1.62 or 1.623…
(b)(i)\(\frac{14}{120}\)
(ii)\(\frac{21}{20060}\)
(c)(i) 55, 79, 106, 120
(ii) Correct diagram
(d)(i) 1.62 to 1.63
(ii) 1.57 to 1.58
Question
A school nurse records the height, h cm, of each of 180 children.
The table shows the information.
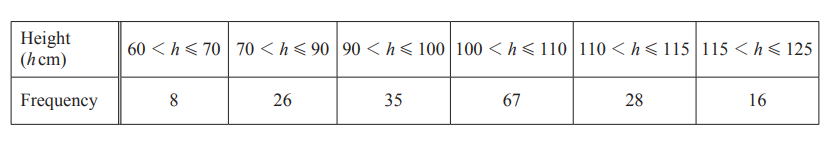
(a) Calculate an estimate of the mean.
Give your answer correct to 1 decimal place.
…………………………………… cm
(b) In a histogram showing the information, the height of the bar for the interval \(60< h\leq 70\) is 0.4cm.
Calculate the height of the bar for each of the following intervals.
\(115 < h\leq 125 ……………………………… cm\)
\(110<h\leq 115 ……………………………… cm\)
\(70<h \leq 90 ……………………………….. cm\)
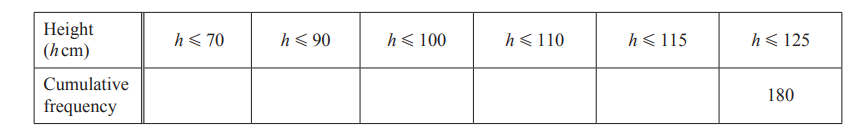
(c) Complete the cumulative frequency table below.
(d) On the grid opposite, draw a cumulative frequency diagram.
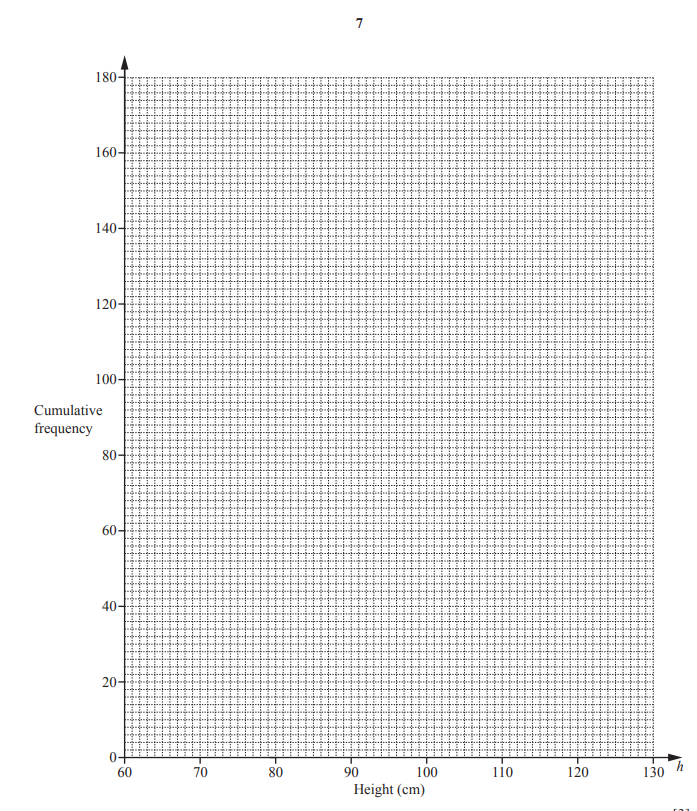
(e) Use your cumulative frequency diagram to find an estimate of
(i) the interquartile range,
…………………………………… cm
(ii) the 70th percentile,
…………………………………… cm
(iii) the number of children with height greater than 106cm.
…………………………………………
Answer/Explanation
(a) 100.2
(b) 0.8
2.8
0.65
(c) 8 34 69 136 164
(d) Correct diagram
(e)(i) 15 to 17
(ii) 107 to 109
(iii) 66 to 72