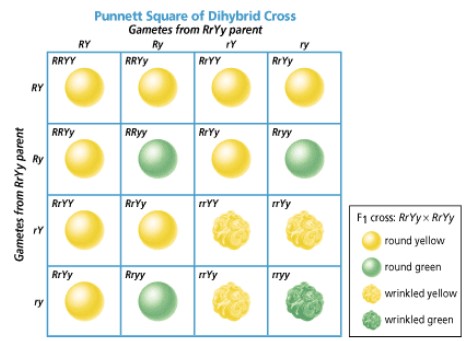
Dihybrid cross
- A dihybrid cross is a cross between two individuals that shows the inheritance of two different genes at the same time; usually involving unlinked autosomal genes.
- Note: The following example contains two unlinked genes, which means the genes are on different chromosomes. This means they follow Mendel’s law of independent assortment.
- Mendel’s law of independent assortment states allele pairs separate independently from other allele pairs during gamete formation (meiosis).
- Therefore, traits on different chromosomes are transmitted to the offspring independently of traits on other chromosomes.
- An exception to this rule is linked genes
- The standard ratio of phenotypes is 9:3:3:1
- Test cross: unknown genotypes crosses with homozygous receive
- True breed: homozygous
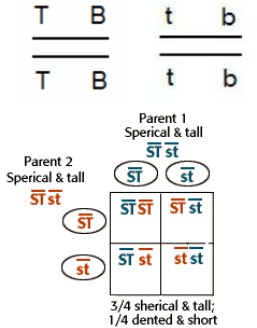
Linked genes:
- Location of genes are on the same chromosome
- The genotypes represented on the right show that T and B are on the same chromosome with one pair on the maternal chromosome and one pair on the paternal chromosome
- The horizontal line represents the homologous chromosomes
- The same can be said about the alleles t and b
- Crossing over can occur between the non-sister chromatids during prophase I of meiosis resulting in offspring with different genotypes
- The gametes Tb and tB could also occur with crossing over, resulting in the recombinant offspring TtBB and TTBb
- Recombinants have different alleles combinations than either of the parents
- When we do not consider crossing over happening, two linked genes will travel together to the gametes, which means, during the punnett square, they need to be considered as a single gene, which gives the standard result of 3:1
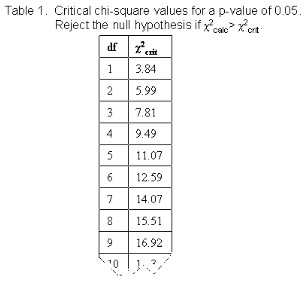
Chi-square test:
- A chi-square test is a statistical test that can be used to determine whether observed frequencies are significantly different from expected frequencies
- These statistical tests enable us to compare observed and expected frequencies empirically and to decide if the results we see are statistically significant. Statistical significance in this case implies that the differences are not due to chance alone, but instead may be caused by other factors at work.
- This is the formula for a chi-squared test \(x^2=\sum \frac{(o_i-e_i)^2)}{e_i}\), where o means observed
group and e means expected groups - What it basically means is the sum of the (observed minus the expected) squared, divided by
the expected. - We can have two hypothesis out of Chi-square test
- Null hypothesis: data is due to chance and is random due to independent assortment – punnett square ratios are excepted.
- Alternative hypothesis: data is not due to chance and is not random, something influence the data
- Check the value with degree of freedom (0.05 column) corresponding the value of (number of set of data – 1) e.g. 2 phonotypes – 1 set of data.
- If the result is less than the critical value, accept null hypothesis
- If the result is more than the critical value, reject the null hypothesis