Question
A 20. mL sample of 0.50 M \(HC_{2}H_{3}O_{2}\)(aq) is titrated with 0.50 M NaOH(aq). Which of the following best represents the species that react and the species produced in the reaction?
(A) \(H^{+}(aq) + OH^{−}(aq) → H_{2}O(l)\)
(B) \(H^{+}(aq) + C_{2}H_{3}O_{2}^{−}(aq) + Na^{+}(aq) + OH^{−}(aq)\) →\( H_{2}O(l) + NaC_{2}H_{3}O_{2}\)(aq)
(C) \(HC_{2}H_{3}O_{2}(aq)\) + OH^{−}(aq) → \(C_{2}H_{3}O_{2}^{−}(aq) + H_{2}O(l)\)
(D) \(HC_{2}H_{3}O_{2}(aq) + NaOH(aq) \)→ \(H_{2}O(l) + Na+(aq) + C_{2}H_{3}O_{2}^{−}\)(aq)
▶️Answer/Explanation
Ans:D
Question
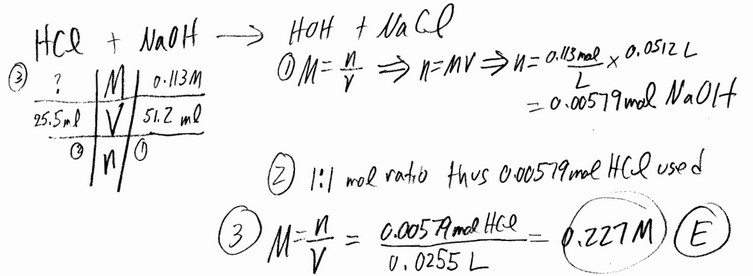
A 25.5 mL aliquot of HCl (aq) of unknown concentration was titrated with 0.113 M NaOH (aq). It took 51.2 mL
of the base to reach the endpoint of the titration. What was the concentration (M) of the acid?
A) 0.454 B) 0.113 C) 1.02 D) 0.114 E) 0.227
▶️Answer/Explanation
Ans: E
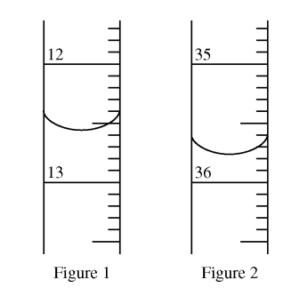
Questions (a)-(b) refer to the figures below. The figures show portions of a buret used in a titration of an acid solution of known concentration with a saturated solution of Ba(OH)2. Figures 1 and 2 show the level of the Ba(OH)2 solution at the start and at the endpoint of the titration, respectively. Phenolphthalein was used as the indicator for the titration.
Question(a)
What is the evidence that the endpoint of the titration has been reached?
(A) The color of the solution in the buret changes from pink to colorless.
(B) The color of the solution in the buret changes from blue to red.
(C) The color of the contents of the flask below the buret changes from colorless to pink.
(D) The color of the contents of the flask below the buret changes from blue to red.
(E) The contents of the flask below the buret change from clear to cloudy.
▶️Answer/Explanation
Ans:C
Question(b)
The volume of saturated Ba(OH)2 used to neutralize the acid was closest to
(A) 6.60 mL
(B) 22.80 mL
(C) 23.02 mL
(D) 23.20 mL
(E) 29.80 mL
▶️Answer/Explanation
Ans:D
Questions (a)-(b)
The graph below shows the titration curve that results when 100. mL of 0.0250 M acetic acid is titrated with 0.100 M NaOH.
Question(a)
Which of the following indicators is the best choice for this titration?
Indicator pH Range of
Color Change
A) Methyl orange 3.2 – 4.4
B) Methyl red 4.8 – 6.0
C) Bromothymol blue 6.1 – 7.6
D) Phenolphthalein 8.2 – 10.0
E) Alizarin 11.0 – 12.4
▶️Answer/Explanation
Ans:D
You should choose an indicator that changes color (end point) at a pH that coincides with the stoichiometric equivalence point (moles acid = moles base). That indicator will have a Ka in the neighborhood of 1 × 10–pH. This question gives you graph and then a table to analyze. The geometric midpoint of the tall vertical region of the graph is the equivalence point. Read the y-axis to determine the pH, in this case about 9, so phenolphthalein is the indicator to choose.
DIF: Easy TOP: Acid-Base MSC: 2002 #33 NOT: 70% answered correctly
Question(b)
What part of the curve corresponds to the optimum buffer action for the acetic acid/acetate ion pair?
A) Point V
B) Point X
C) Point Z
D) Along all of section WY
E) Along all of section YZ
▶️Answer/Explanation
Ans:A
The equivalence point occurs when 25 mL of NaOH has been added. So, when 12.5 mL was added, half of the weak acid was neutralized to form a solution that still contained 1/2 weak acid but also contained 1/2 of its salt (conjugate base). That’s an ideal buffer with maximum buffering capacity.
DIF: Hard TOP: Acid-Base MSC: 2002 #34 NOT: 34% answered correctly