Question
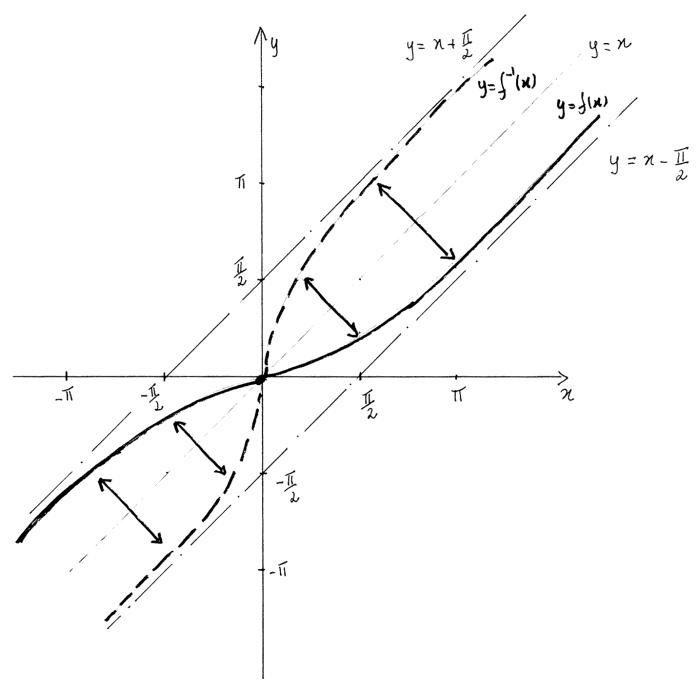
Let f be a function defined by \(f(x) = x – \arctan x\) , \(x \in \mathbb{R}\) .
(a) Find \(f(1)\) and \(f\left( { – \sqrt 3 } \right)\).
(b) Show that \(f( – x) = – f(x)\) , for \(x \in \mathbb{R}\) .
(c) Show that \(x – \frac{\pi }{2} < f(x) + \frac{\pi }{2}\) , for \(x \in \mathbb{R}\) .
(d) Find expressions for \(f'(x)\) and \(f”(x)\) . Hence describe the behaviour of the graph of f at the origin and justify your answer.
(e) Sketch a graph of f , showing clearly the asymptotes.
(f) Justify that the inverse of f is defined for all \(x \in \mathbb{R}\) and sketch its graph.
Answer/Explanation
Markscheme
(a) \(f(1) = 1 – \arctan 1 = 1 – \frac{\pi }{4}\) A1
\(f( – \sqrt 3 ) = – \sqrt 3 – \arctan ( – \sqrt 3 ) = – \sqrt 3 + \frac{\pi }{3}\) A1
[2 marks]
(b) \(f( – x) = – x – \arctan ( – x)\) M1
\( = – x + \arctan x\) A1
\( = – (x – \arctan x)\)
\( = – f(x)\) AG N0
[2 marks]
(c) as \( – \frac{\pi }{2} < \arctan x < \frac{\pi }{2}\), for any \(x \in \mathbb{R}\) A1
\( \Rightarrow – \frac{\pi }{2} < – \arctan x < \frac{\pi }{2}\), for any \(x \in \mathbb{R}\)
then by adding x (or equivalent) R1
we have \(x – \frac{\pi }{2} < x – \arctan x < x + \frac{\pi }{2}\) AG N0
[2 marks]
(d) \(f'(x) = 1 – \frac{1}{{1 + {x^2}}}{\text{ or }}\frac{{{x^2}}}{{1 + {x^2}}}\) A1A1
\(f”(x) = \frac{{2x(1 + {x^2}) – 2{x^3}}}{{{{(1 + {x^2})}^2}}}{\text{or }}\frac{{2x}}{{{{(1 + {x^2})}^2}}}\) M1A1
\(f'(0) = f”(0) = 0\) A1A1
EITHER
as \(f'(x) \geqslant 0\) for all values of \(x \in \mathbb{R}\)
(\((0,{\text{ 0)}}\)is not an extreme of the graph of f (or equivalent )) R1
OR
as \(f”(x) > 0\)for positive values of x and \(f”(x) < 0\) for negative values of x R1
THEN
(0, 0) is a point of inflexion of the graph of f (with zero gradient) A1 N2
[8 marks]
(e)
 A1A1A1
Note: Award A1 for both asymptotes.
A1 for correct shape (concavities) \(x < 0\) .
A1 for correct shape (concavities) \(x > 0\) .
[3 marks]
(f) (see sketch above)
as f is increasing (and therefore one-to-one) and its range is \(\mathbb{R}\) ,
\({f^{ – 1}}\) is defined for all \(x \in \mathbb{R}\) R1
use the result that the graph of \(y = {f^{ – 1}}(x)\) is the reflection
in the line y = x of the graph of \(y = f(x)\) to draw the graph of \({f^{ – 1}}\) (M1)A1
[3 marks]
Total [20 marks]
Examiners report
Parts of this question were answered quite well by many candidates. A few candidates had difficulties with domain of arctan in part (a) and in justifying their reasoning in parts (b) and (c). In part (d) although most candidates were successful in finding the expressions of the derivatives and their values at x = 0, many were unable to use the results to find the nature of the curve at the origin. Very few candidates were successful in answering parts (e) and (f).
Question
The diagram below shows a sketch of the gradient function \(f'(x)\) of the curve \(f(x)\) .
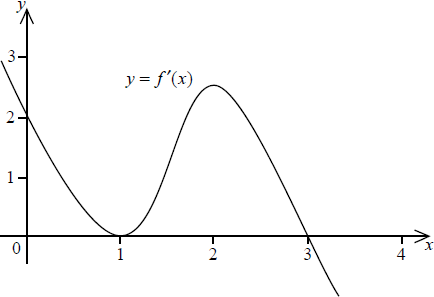
On the graph below, sketch the curve \(y = f(x)\) given that \(f(0) = 0\) . Clearly indicate on the graph any maximum, minimum or inflexion points.
Answer/Explanation
Markscheme
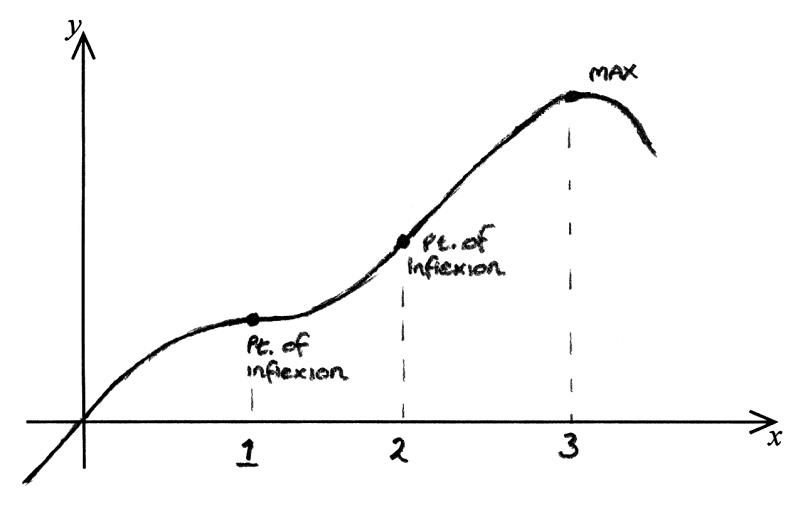 A5
A5
Note: Award A1 for origin
A1 for shape
A1 for maximum
A1 for each point of inflexion.
[5 marks]
Examiners report
A reasonable number of candidates answered this correctly, although some omitted the \({2^{{\text{nd}}}}\) point of inflection.
Question
Consider \(f(x) = \frac{{{x^2} – 5x + 4}}{{{x^2} + 5x + 4}}\).
(a) Find the equations of all asymptotes of the graph of f.
(b) Find the coordinates of the points where the graph of f meets the x and y axes.
(c) Find the coordinates of
(i) the maximum point and justify your answer;
(ii) the minimum point and justify your answer.
(d) Sketch the graph of f, clearly showing all the features found above.
(e) Hence, write down the number of points of inflexion of the graph of f.
Answer/Explanation
Markscheme
(a) \({x^2} + 5x + 4 = 0 \Rightarrow x = – 1{\text{ or }}x = – 4\) (M1)
so vertical asymptotes are x = – 1 and x = – 4 A1
as \(x \to \infty \) then \(y \to 1\) so horizontal asymptote is y = 1 (M1)A1
[4 marks]
(b) \({x^2} – 5x + 4 = 0 \Rightarrow x = 1{\text{ or }}x = 4\) A1
\(x = 0 \Rightarrow y = 1\) A1
so intercepts are (1, 0), (4, 0) and (0,1)
[2 marks]
(c) (i) \(f'(x) = \frac{{({x^2} + 5x + 4)(2x – 5) – ({x^2} – 5x + 4)(2x + 5)}}{{{{({x^2} + 5x + 4)}^2}}}\) M1A1A1
\( = \frac{{10{x^2} – 40}}{{{{({x^2} + 5x + 4)}^2}}}\,\,\,\,\,\left( { = \frac{{10(x – 2)(x + 2)}}{{{{({x^2} + 5x + 4)}^2}}}} \right)\) A1
\(f'(x) = 0 \Rightarrow x = \pm 2\) M1
so the points under consideration are (–2, –9) and \(\left( {2, – \frac{1}{9}} \right)\) A1A1
looking at the sign either side of the points (or attempt to find \(f”(x)\)) M1
e.g. if \(x = – {2^ – }\) then \((x – 2)(x + 2) > 0\) and if \(x = – {2^ + }\) then \((x – 2)(x + 2) < 0\),
therefore (–2, –9) is a maximum A1
(ii) e.g. if \(x = {2^ – }\) then \((x – 2)(x + 2) < 0\) and if \(x = {2^ + }\) then \((x – 2)(x + 2) > 0\),
therefore \(\left( {2, – \frac{1}{9}} \right)\) is a minimum A1
Note: Candidates may find the minimum first.
[10 marks]
(d)
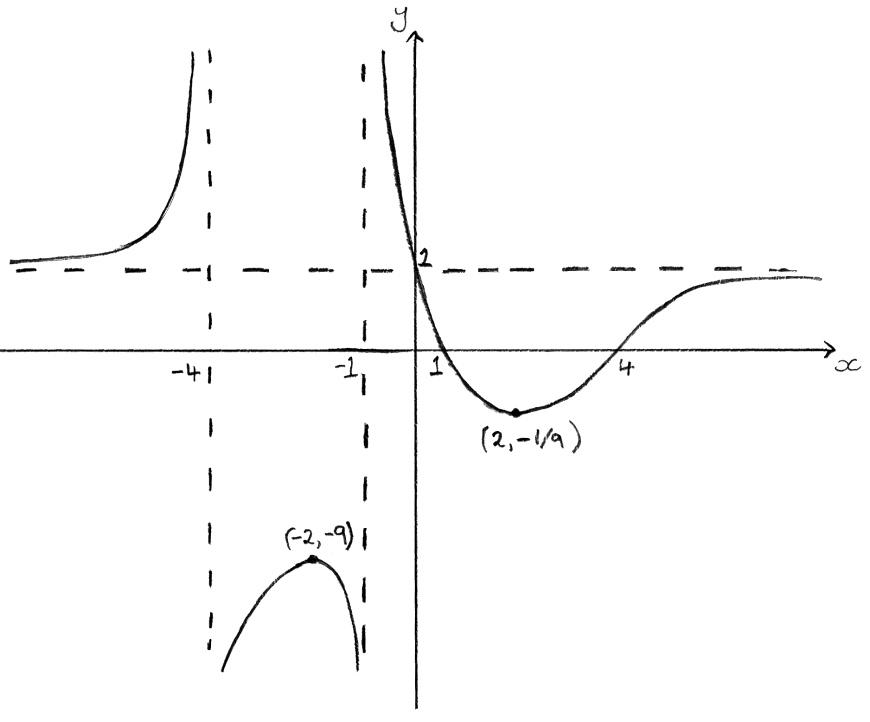 A3
A3
Note: Award A1 for each branch consistent with and including the features found in previous parts.
[3 marks]
(e) one A1
[1 mark]
Total [20 marks]
Examiners report
This was the most successfully answered question in part B, in particular parts (a), (b) and (c). In part (a) the horizontal asymptote was often missing (or x = 4, x = 1 given). Part (b) was well done. Use of the quotient rule was well done in part (c) and many simplified correctly. There was knowledge of max/min and how to justify their answer, usually with a sign diagram but also with the second derivative. A common misconception was that, as \( – 9 < – \frac{1}{9}\), the minimum is at (–2, –9). In part (d) many candidates were unable to sketch the graph consistent with the main features that they had determined before. Very few candidates answered part (e) correctly.
Question
Consider the function \(f(x) = \frac{{\ln x}}{x}\) , \(0 < x < {{\text{e}}^2}\) .
(i) Solve the equation \(f'(x) = 0\) .
(ii) Hence show the graph of \(f\) has a local maximum.
(iii) Write down the range of the function \(f\) .
Show that there is a point of inflexion on the graph and determine its coordinates.
Sketch the graph of \(y = f(x)\) , indicating clearly the asymptote, x-intercept and the local maximum.
Now consider the functions \(g(x) = \frac{{\ln \left| x \right|}}{x}\) and \(h(x) = \frac{{\ln \left| x \right|}}{{\left| x \right|}}\) , where \(0 < x < {{\text{e}}^2}\) .
(i) Sketch the graph of \(y = g(x)\) .
(ii) Write down the range of \(g\) .
(iii) Find the values of \(x\) such that \(h(x) > g(x)\) .
Answer/Explanation
Markscheme
(i) \(f'(x) = \frac{{x\frac{1}{x} – \ln x}}{{{x^2}}}\) M1A1
\( = \frac{{1 – \ln x}}{{{x^2}}}\)
so \(f'(x) = 0\) when \(\ln x = 1\), i.e. \(x = {\text{e}}\) A1
(ii) \(f'(x) > 0\) when \(x < {\text{e}}\) and \(f'(x) < 0\) when \(x > {\text{e}}\) R1
hence local maximum AG
Note: Accept argument using correct second derivative.
(iii) \(y \leqslant \frac{1}{{\text{e}}}\) A1
[5 marks]
\(f”(x) = \frac{{{x^2}\frac{{ – 1}}{x} – \left( {1 – \ln x} \right)2x}}{{{x^4}}}\) M1
\( = \frac{{ – x – 2x + 2x\ln x}}{{{x^4}}}\)
\( = \frac{{ – 3 + 2\ln x}}{{{x^3}}}\) A1
Note: May be seen in part (a).
\(f”(x) = 0\) (M1)
\({ – 3 + 2\ln x = 0}\)
\(x = {{\text{e}}^{\frac{3}{2}}}\)
since \(f”(x) < 0\) when \(x < {{\text{e}}^{\frac{3}{2}}}\) and \(f”(x) > 0\) when \(x > {{\text{e}}^{\frac{3}{2}}}\) R1
then point of inflexion \(\left( {{{\text{e}}^{\frac{3}{2}}},\frac{3}{{2{{\text{e}}^{\frac{3}{2}}}}}} \right)\) A1
[5 marks]
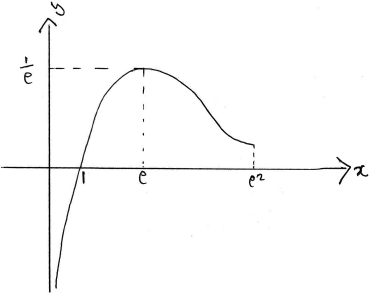 A1A1A1
Note: Award A1 for the maximum and intercept, A1 for a vertical asymptote and A1 for shape (including turning concave up).
[3 marks]
(i)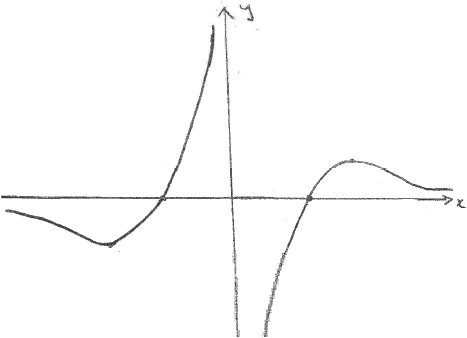 A1A1
A1A1
Note: Award A1 for each correct branch.
(ii) all real values A1
(iii)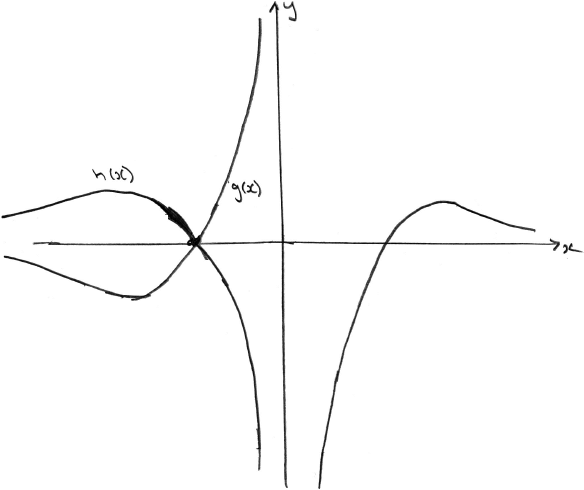 (M1)(A1)
Note: Award (M1)(A1) for sketching the graph of h, ignoring any graph of g.
\( – {{\text{e}}^2} < x < – 1\) (accept \(x < – 1\) ) A1
[6 marks]
Examiners report
Most candidates attempted parts (a), (b) and (c) and scored well, although many did not gain the reasoning marks for the justification of the existence of local maximum and inflexion point. The graph sketching was poorly done. A wide selection of range shapes were seen, in some cases showing little understanding of the relation between the derivatives of the function and its graph and difficulties with transformation of graphs. In some cases candidates sketched graphs consistent with their previous calculations but failed to label them properly.
Most candidates attempted parts (a), (b) and (c) and scored well, although many did not gain the reasoning marks for the justification of the existence of local maximum and inflexion point. The graph sketching was poorly done. A wide selection of range shapes were seen, in some cases showing little understanding of the relation between the derivatives of the function and its graph and difficulties with transformation of graphs. In some cases candidates sketched graphs consistent with their previous calculations but failed to label them properly.
Most candidates attempted parts (a), (b) and (c) and scored well, although many did not gain the reasoning marks for the justification of the existence of local maximum and inflexion point. The graph sketching was poorly done. A wide selection of range shapes were seen, in some cases showing little understanding of the relation between the derivatives of the function and its graph and difficulties with transformation of graphs. In some cases candidates sketched graphs consistent with their previous calculations but failed to label them properly.
Most candidates attempted parts (a), (b) and (c) and scored well, although many did not gain the reasoning marks for the justification of the existence of local maximum and inflexion point. The graph sketching was poorly done. A wide selection of range shapes were seen, in some cases showing little understanding of the relation between the derivatives of the function and its graph and difficulties with transformation of graphs. In some cases candidates sketched graphs consistent with their previous calculations but failed to label them properly.
Question
The graphs of \(y = \left| {x + 1} \right|\) and \(y = \left| {x – 3} \right|\) are shown below.
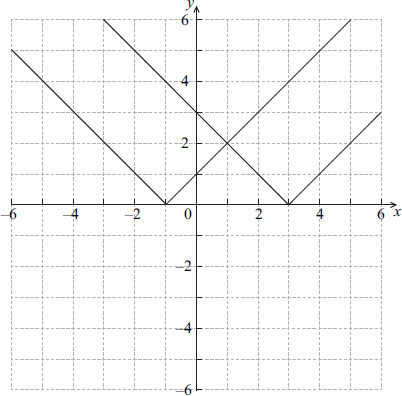
Let f (x) = \(\left| {\,x + 1\,} \right| – \left| {\,x – 3\,} \right|\).
Draw the graph of y = f (x) on the blank grid below.
Hence state the value of
(i) \(f'( – 3)\);
(ii) \(f'(2.7)\);
(iii) \(\int_{ – 3}^{ – 2} {f(x)dx} \).
Answer/Explanation
Markscheme
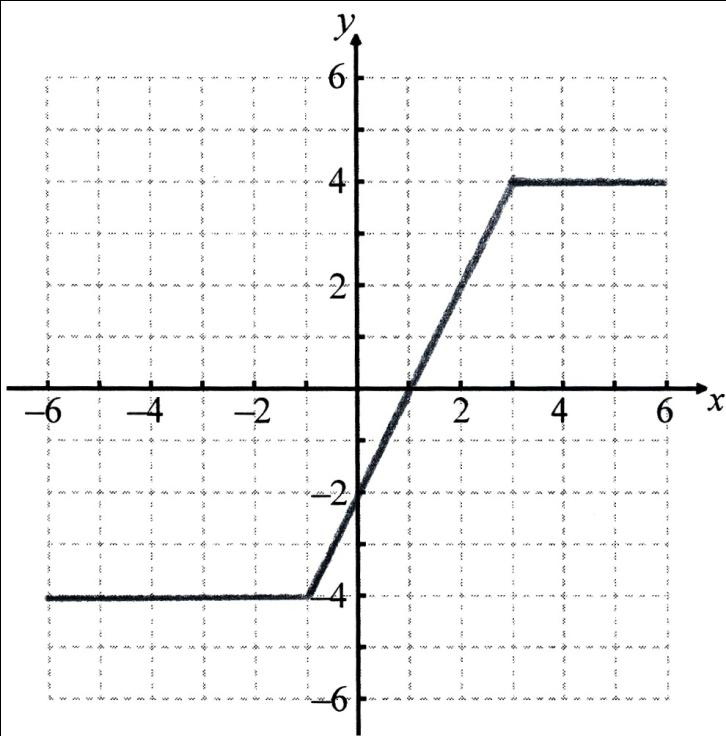 M1A1A1A1
Note: Award M1 for any of the three sections completely correct, A1 for each correct segment of the graph.
[4 marks]
(i) 0 A1
(ii) 2 A1
(iii) finding area of rectangle (M1)
\( – 4\) A1
Note: Award M1A0 for the answer 4.
[4 marks]
Examiners report
Most candidates were able to produce a good graph, and many were able to interpret that to get correct answers to part (b). The most common error was to give 4 as the answer to (b) (iii). Some candidates did not recognise that the “hence” in the question meant that they had to use their graph to obtain their answers to part (b).
Most candidates were able to produce a good graph, and many were able to interpret that to get correct answers to part (b). The most common error was to give 4 as the answer to (b) (iii). Some candidates did not recognise that the “hence” in the question meant that they had to use their graph to obtain their answers to part (b).
Question
The graph of \(y = f(x)\) is shown below, where A is a local maximum point and D is a local minimum point.
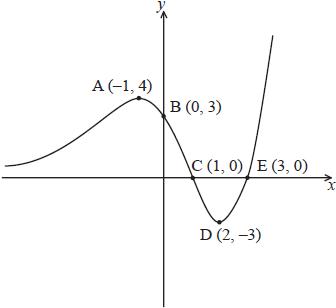
On the axes below, sketch the graph of \(y = \frac{1}{{f(x)}}\) , clearly showing the coordinates of the images of the points A, B and D, labelling them \({{\text{A}’}}\), \({{\text{B}’}}\), and \({{\text{D}’}}\) respectively, and the equations of any vertical asymptotes.
On the axes below, sketch the graph of the derivative \(y = f'(x)\) , clearly showing the coordinates of the images of the points A and D, labelling them \({{\text{A}}}”\) and \({{\text{D}}}”\) respectively.
Answer/Explanation
Markscheme
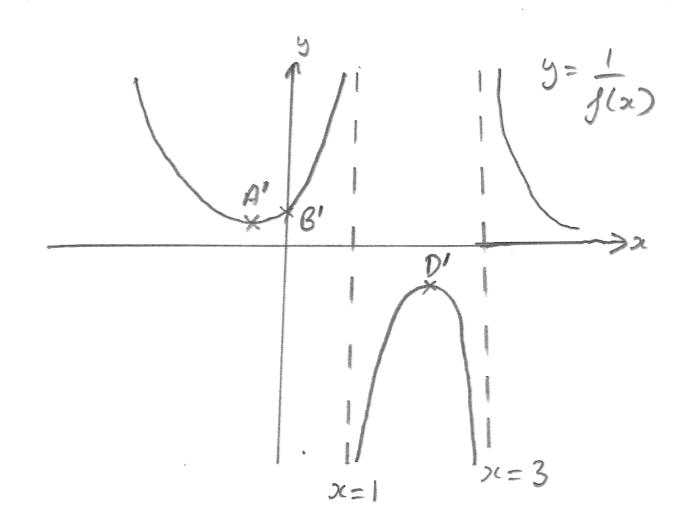 A1A1A1
Note: Award A1 for correct shape.
Award A1 for two correct asymptotes, and \(x = 1\) and \(x = 3\) .
Award A1 for correct coordinates, \({\text{A}’}\left( { – 1,\frac{1}{4}} \right),{\text{ B}’}\left( {0,\frac{1}{3}} \right){\text{ and D}’}\left( {2, -\frac{1}{3}} \right)\).
[3 marks]
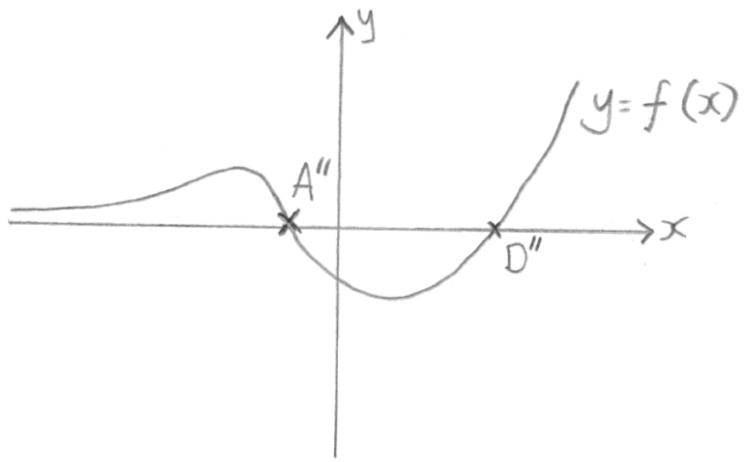 A1A1A1
Note: Award A1 for correct general shape including the horizontal asymptote.
Award A1 for recognition of 1 maximum point and 1 minimum point.
Award A1 for correct coordinates, \({\text{A}}”( – 1,0)\) and \({\text{D}}”(2,0)\) .
[3 marks]
Examiners report
Solutions to this question were generally disappointing. In (a), the shape of the graph was often incorrect and many candidates failed to give the equations of the asymptotes and the coordinates of the image points. In (b), many candidates produced incorrect graphs although the coordinates of the image points were often given correctly.
Solutions to this question were generally disappointing. In (a), the shape of the graph was often incorrect and many candidates failed to give the equations of the asymptotes and the coordinates of the image points. In (b), many candidates produced incorrect graphs although the coordinates of the image points were often given correctly.