IB DP Maths Topic 7.6 Null and alternative hypotheses, H0 and H1 HL Paper 3

Question

a.Ten friends try a diet which is claimed to reduce weight. They each weigh themselves before starting the diet, and after a month on the diet, with the following results.


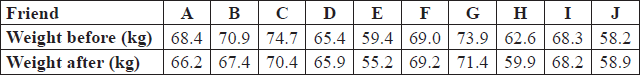
Determine unbiased estimates of the mean and variance of the loss in weight achieved over the month by people using this diet.[5]


b.(i)     State suitable hypotheses for testing whether or not this diet causes a mean loss in weight.

(ii)     Determine the value of a suitable statistic for testing your hypotheses.

(iii)     Find the 1 % critical value for your statistic and state your conclusion.[6]

 
▶️Answer/Explanation

Markscheme

the weight losses are

2.2\(\,\,\,\,\,\)3.5\(\,\,\,\,\,\)4.3\(\,\,\,\,\,\)–0.5\(\,\,\,\,\,\)4.2\(\,\,\,\,\,\)–0.2\(\,\,\,\,\,\)2.5\(\,\,\,\,\,\)2.7\(\,\,\,\,\,\)0.1\(\,\,\,\,\,\)–0.7     (M1)(A1)

\(\sum {x = 18.1} \), \(\sum {{x^2} = 67.55} \)

UE of mean = 1.81     A1

UE of variance \( = \frac{{67.55}}{9} – \frac{{{{18.1}^2}}}{{90}} = 3.87\)     (M1)A1

Note: Accept weight losses as positive or negative. Accept unbiased estimate of mean as positive or negative.


Note: Award M1A0 for 1.97 as UE of variance.


[5 marks]

a.

(i)     \({H_0}:{\mu _d} = 0\) versus \({H_1}:{\mu _d} > 0\)     A1

Note: Accept any symbol for \({\mu _d}\)


(ii)     using t test     (M1)

\(t = \frac{{1.81}}{{\sqrt {\frac{{3.87}}{{10}}} }} = 2.91\)     A1


(iii)     DF = 9     (A1)

Note: Award this (A1) if the p-value is given as 0.00864


1% critical value = 2.82     A1

accept \({H_1}\)     R1

Note: Allow FT on final R1.


[6 marks]

b.

Examiners report

In (a), most candidates gave a correct estimate for the mean but the variance estimate was often incorrect. Some candidates who use their GDC seem to be unable to obtain the unbiased variance estimate from the numbers on the screen. The way to proceed, of course, is to realise that the larger of the two ‘standard deviations’ on offer is the square root of the unbiased estimate so that its square gives the required result. In (b), most candidates realised that the t-distribution should be used although many were awarded an arithmetic penalty for giving either t = 2.911 or the critical value = 2.821. Some candidates who used the p-value method to reach a conclusion lost a mark by omitting to give the critical value. Many candidates found part (c) difficult and although they were able to obtain t = 2.49…, they were then unable to continue to obtain the confidence interval.

a.

In (a), most candidates gave a correct estimate for the mean but the variance estimate was often incorrect. Some candidates who use their GDC seem to be unable to obtain the unbiased variance estimate from the numbers on the screen. The way to proceed, of course, is to realise that the larger of the two ‘standard deviations’ on offer is the square root of the unbiased estimate so that its square gives the required result. In (b), most candidates realised that the t-distribution should be used although many were awarded an arithmetic penalty for giving either t = 2.911 or the critical value = 2.821. Some candidates who used the p-value method to reach a conclusion lost a mark by omitting to give the critical value. Many candidates found part (c) difficult and although they were able to obtain t = 2.49…, they were then unable to continue to obtain the confidence interval.

b.

Question

The random variable X has a Poisson distribution with unknown mean \(\mu \) . It is required to test the hypotheses

\({H_0}:\mu  = 3\) against \({H_1}:\mu  \ne 3\) .

Let S denote the sum of 10 randomly chosen values of X . The critical region is defined as \((S \leqslant 22) \cup (S \geqslant 38)\) .

a.Calculate the significance level of the test.[5]


b.Given that the value of \(\mu \) is actually 2.5, determine the probability of a Type II error.[5]

 
▶️Answer/Explanation

Markscheme

under \({H_0}\) , \(S{\text{ is Po}}(30)\)     (A1)

EITHER

\({\text{P}}(S \leqslant 22) = {\text{0.080569}} \ldots \)     A1

\({\text{P}}(S \geqslant 38) = {\text{0.089012}} \ldots \)     A1

significance level = 0.080569… + 0.089012…     (M1)

= 0.170     A1

OR

\({\text{P}}(S \leqslant 22) = {\text{0.080569}} \ldots \)     A1

\({\text{P}}(S \leqslant 37) = {\text{0.910987}} \ldots \)     A1

significance level = 1 – (0.910987…) + 0.089012…     (M1)

= 0.170     A1

Note: Accept 17 % or 0.17.


Note: Award 2 marks out of the final 4 marks for correct use of the Central Limit Theorem, giving 0.144 without a continuity correction and 0.171 with a continuity correction. The first (A1) is independent.


[5 marks]

a.

S is now Po(25)     (A1)

P (Type II error) = P (accept \({H_0}|\mu = 2.5\))     (M1)

\( = {\text{P}}\left( {23 \leqslant S \leqslant 37|S{\text{ is Po}}(25)} \right)\)     (M1)

Note: Only one of the above M1 marks can be implied.


= 0.990789… – 0.317533…     (A1)

= 0.673     A1

Note: Award 2 marks out of the final 4 marks for correct use of the Central Limit Theorem, giving 0.647 without a continuity correction and 0.685 with a continuity correction. The first (A1) is independent.


[5 marks]

b.

Examiners report

Solutions to this question were often disappointing with many candidates not knowing what had to be done. Even those candidates who knew what to do sometimes made errors in evaluating the probabilities, often by misinterpreting the inequality signs. Candidates who used the Central Limit Theorem to evaluate the probabilities were given only partial credit on the grounds that the answers obtained were approximate and not exact.

a.

Solutions to this question were often disappointing with many candidates not knowing what had to be done. Even those candidates who knew what to do sometimes made errors in evaluating the probabilities, often by misinterpreting the inequality signs. Candidates who used the Central Limit Theorem to evaluate the probabilities were given only partial credit on the grounds that the answers obtained were approximate and not exact.

b.

Question

A baker produces loaves of bread that he claims weigh on average 800 g each. Many customers believe the average weight of his loaves is less than this. A food inspector visits the bakery and weighs a random sample of 10 loaves, with the following results, in grams:

783, 802, 804, 785, 810, 805, 789, 781, 800, 791.

Assume that these results are taken from a normal distribution.

a.Determine unbiased estimates for the mean and variance of the distribution.[3]


b.In spite of these results the baker insists that his claim is correct.

Stating appropriate hypotheses, test the baker’s claim at the 10 % level of significance.[7]

 
▶️Answer/Explanation

Markscheme

unbiased estimate of the mean: 795 (grams)     A1

unbiased estimate of the variance: 108 \((gram{s^2})\)     (M1)A1

[3 marks]

a.

null hypothesis \({H_0}:\mu  = 800\)     A1

alternative hypothesis \({H_1}:\mu  < 800\)     A1

using 1-tailed t-test     (M1)

EITHER

p = 0.0812…     A3

OR

with 9 degrees of freedom     (A1)

\({t_{calc}} = \frac{{\sqrt {10} (795 – 800)}}{{\sqrt {108} }} = – 1.521\)     A1

\({t_{crit}} = – 1.383\)     A1 

Note: Accept 2sf intermediate results.


THEN

so the baker’s claim is rejected     R1 

Note: Accept “reject \({H_0}\) ” provided \({H_0}\) has been correctly stated.


Note: FT for the final R1.


[7 marks]

b.

Examiners report

A successful question for many candidates. A few candidates did not read the question and adopted a 2-tailed test.

a.

A successful question for many candidates. A few candidates did not read the question and adopted a 2-tailed test.

b.

Question

The random variable X represents the height of a wave on a particular surf beach.

a.It is known that X is normally distributed with unknown mean \(\mu \) (metres) and known variance \({\sigma ^2} = \frac{1}{4}{\text{ (metre}}{{\text{s}}^2}{\text{)}}\) . Sally wishes to test the claim made in a surf guide that \(\mu  = 3\) against the alternative that \(\mu  < 3\) . She measures the heights of 36 waves and calculates their sample mean \({\bar x}\) . She uses this value to test the claim at the 5 % level.

(i)     Find a simple inequality, of the form \(\bar x < A\) , where A is a number to be determined to 4 significant figures, so that Sally will reject the null hypothesis, that \(\mu  = 3\) , if and only if this inequality is satisfied.

(ii)     Define a Type I error.

(iii)     Define a Type II error.

(iv)     Write down the probability that Sally makes a Type I error.

(v)     The true value of \(\mu \) is 2.75. Calculate the probability that Sally makes a Type II error.[11]


b.The random variable Y represents the height of a wave on another surf beach. It is known that Y is normally distributed with unknown mean \(\mu \) (metres) and unknown variance \({\sigma ^2}{\text{ (metre}}{{\text{s}}^2}{\text{)}}\) . David wishes to test the claim made in a surf guide that \(\mu = 3\) against the alternative that \(\mu < 3\) . He is also going to perform this test at the 5 % level. He measures the heights of 36 waves and finds that the sample mean, \(\bar y = 2.860\) and the unbiased estimate of the population variance, \(s_{n – 1}^2 = 0.25\).

(i)     State the name of the test that David should perform.

(ii)     State the conclusion of David’s test, justifying your answer by giving the p-value.

(iii)     Using David’s results, calculate the 90 % confidence interval for \(\mu \) , giving your answers to 4 significant figures.[8]

 
▶️Answer/Explanation

Markscheme

(i)     \({H_0}:\mu = 3,{\text{ }}{H_1}:\mu < 3\)

1 tailed z test as \({\sigma ^2}\) is known

under \({H_0}{\text{, }}X \sim {\text{N}}\left( {3,\frac{1}{4}} \right){\text{ so }}\bar X \sim {\text{N}}\left( {3,\frac{{\frac{1}{4}}}{{36}}} \right) = N\left( {3,\frac{1}{{144}}} \right)\)     (M1)

\(z = \frac{{\bar x – 3}}{{\frac{1}{{12}}}}{\text{ is N(0, 1)}}\)     (A1)

\({\text{P}}(z < – 1.64485…) = 0.05\)     (A1)

so inequality is given by \(\frac{{\bar x – 3}}{{\frac{1}{{12}}}} < – 1.64485…{\text{ giving }}\bar x < 2.8629…\)     M1

\(\bar x < 2.863{\text{ (4sf)}}\)     A1

Note: Candidates can get directly to the answer from \({\text{N}}\left( {3,\frac{1}{{144}}} \right)\) they do not have to go via z is N(0, 1) . However they must give some explanation of what they have done; they cannot just write the answer down.


(ii)     a Type I error is accepting \({H_1}\) when \({H_0}\) is true     A1


(iii)     a Type II error is accepting \({H_0}\) when \({H_1}\) is true     A1


(iv)     0.05     A1

Note: Accept anything that rounds to 0.050 if they do the conditional calculation.


(v)     \(\bar X \sim {\text{N}}\left( {2.75,\frac{1}{{144}}} \right)\)     (M1)

\({\text{P}}(\bar x > 2.8629…) = 0.0877{\text{ (3sf)}}\)     (M1)A1

Note: Accept any answer between 0.0875 and 0.0877 inclusive.


Note: Accept anything that rounded is between 0.087and 0.089 if there is evidence that the candidate has used tables.


[11 marks]

a.

(i)     t-test     A1


(ii)     \({{\text{H}}_0}:\mu = 3,{\text{ }}{{\text{H}}_1}:\mu < 3\)

1 tailed t test as \({\sigma ^2}\) is unknown

\(t = \frac{{\bar y – 3}}{{\frac{1}{{12}}}}\) has the t-distribution with \(v = 35\)     (M1)

the p-value is 0.0509…     A2

this is \( > 0.05\)     R1

so we accept that the mean wave height is 3     R1

Note: Allow “Accept \({{\text{H}}_0}\) ” provided \({{\text{H}}_0}\) has been stated.


Note: Accept FT on the p-value for the R1s.


(iii)     \(2.719 < \mu < 3.001{\text{ (4 sf)}}\)     A1A1

Note: \(2.860 \pm 1.6896… \times \frac{{\frac{1}{2}}}{6}\) would gain M1.


Note: Award A1A0 if answer are only given to 3sf.


[8 marks]

b.

Examiners report

(a) There were many reasonable answers. In (i) not all candidates explained their method so that they could gain good partial marks even if they had the wrong final answer. A common mistake was to give an answer above 3. It was pleasing that almost all candidates had (ii) and (iii) correct, as this had caused problems in the past. In (iv) it was amusing to see a few candidates work out 5% using conditional probability rather than just write down the answer as asked.

(b) It was pleasing that almost all candidates realised that it was a t-test rather than a z-test.

There was good understanding on how to use the calculator in parts (ii) and (iii). The correct confidence interval to the desired accuracy was not always given.

The most common mistake in question 3 was forgetting to take into account the variance of the sample mean.

a.

(a) There were many reasonable answers. In (i) not all candidates explained their method so that they could gain good partial marks even if they had the wrong final answer. A common mistake was to give an answer above 3. It was pleasing that almost all candidates had (ii) and (iii) correct, as this had caused problems in the past. In (iv) it was amusing to see a few candidates work out 5% using conditional probability rather than just write down the answer as asked.

(b) It was pleasing that almost all candidates realised that it was a t-test rather than a z-test.

There was good understanding on how to use the calculator in parts (ii) and (iii). The correct confidence interval to the desired accuracy was not always given.

The most common mistake in question 3 was forgetting to take into account the variance of the sample mean.

b.

Question

Francisco and his friends want to test whether performance in running 400 metres improves if they follow a particular training schedule. The competitors are tested before and after the training schedule.

The times taken to run 400 metres, in seconds, before and after training are shown in the following table.

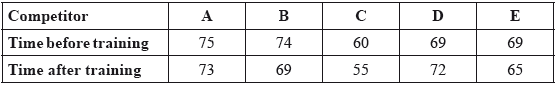
Apply an appropriate test at the 1% significance level to decide whether the training schedule improves competitors’ times, stating clearly the null and alternative hypotheses. (It may be assumed that the distributions of the times before and after training are normal.)

▶️Answer/Explanation

Markscheme

\({{\text{H}}_0}\): the training schedule does not help improve times (or \(\mu  = 0\))     A1

\({{\text{H}}_1}\): the training schedule does help improve times (or \(\mu  > 0\))     A1

Note: Subsequent marks can be awarded even if the hypotheses are not stated.

     (Assuming difference of times is normally distributed.)

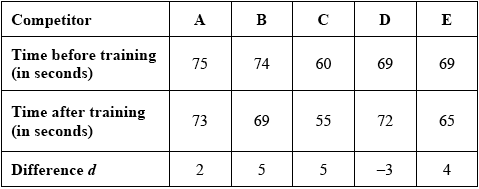
let \(d{\text{ time before training }}-{\text{ time after training}}\)     (M1)


EITHER

\(n = 5,{\text{ }}\sum {d = 13,{\text{ }}} \sum {{d^2} = 79 \Rightarrow s_{n – 1}^2 = \frac{1}{4}\left( {79 – \frac{{169}}{5}} \right) = 11.3} \)     (M1)

(small sample) so use a one-sided t-test     (M1)

Note:     The “one-sided” t-test may have been seen above when stating \({{\text{H}}_1}\).

\(t = \frac{{2.6}}{{\sqrt {\frac{{11.3}}{5}} }} = 1.7 \ldots \)     A1

\(v = 4\),     A1

at the 1% level the critical value is 3.7     A1

since \({\text{3.7}} > {\text{1.7}} \ldots \)

\({{\text{H}}_0}\) is accepted (insufficient evidence to reject \({{\text{H}}_0}\))     R1

Note: Follow through their t-value.

OR

(small sample) so use a one-sided t-test     (M1)

\(p = 0.079 \ldots \)     A4

since \(0.079 \ldots  > 0.01\)

\({{\text{H}}_0}\) is accepted (insufficient evidence to reject \({{\text{H}}_0}\))     R1

Note: Follow through their p-value.

Note: Accept \(d = {\text{time after training }}-{\text{ time before training throughout}}\).

[10 marks]

Examiners report

It was again disappointing to see many candidates giving incorrect hypotheses. A common error was to give the hypotheses the wrong way around. Candidates should be aware that in this type of problem the null hypothesis always represents the status quo. Also, some candidates defined ‘\(d = {\text{time before }}-{\text{ time after}}\)’ and then gave the hypotheses incorrectly as \({{\text{H}}_0}:d = 0\) or \(\bar d = 0;{\text{ }}{{\text{H}}_1}:d > 0\) or \(\bar d > 0\). It is important to note that the parameter being tested here is \(E(d)\) or \({\mu _d}\) although \(\mu \) was accepted.

Scroll to Top