Question
Topic: Method of least squares.
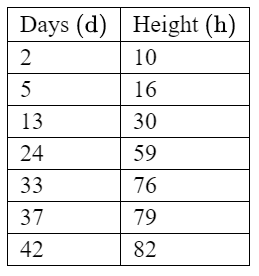
Given: A plant growth experiment is carried out for 42 days. The average height of the plants is recorded on seven different days. The data is shown in the table below.

Calculate: (a) The equation of the line of best fit for the data is h = ad + b, where h is the height and d is the number of days. Find the values of a and b.
(b) Use the equation of the line of best fit to predict the average height of the plants on day 20.
▶️Answer/Explanation
(a) a = 1.93258…, b = 7.21662…
a = 1.93, b = 7.22
Given:
- r = 0.991
- The data points: (2, 10), (5, 16), (13, 30), (24, 59), (33, 76), (37, 79), (42, 82)
Step 1: Calculate the means x̄ and ȳ. \(\bar{x}= \frac{(2 + 5 + 13 + 24 + 33 + 37 + 42)}{7}= 22.29 and \bar{y}= \frac{(10 + 16 + 30 + 59 + 76 + 79 + 82)}{7} = 50.29\)
Step 2: Calculate the slope (a) using the formula: \(a = r \times \frac{s_y}{s_x} \), where \(s_y\) and \(s_x\) are the standard deviations of y and x, respectively.
\(s_y = \sqrt{\frac{\sum_{i=1}^{n}(y_i – \overline{y})^2}{n – 1}}\) and \(s_x = \sqrt{\frac{\sum_{i=1}^{n}(x_i – \overline{x})^2}{n – 1}}\)
Calculating \(s_y\) :
\(\sum_{i=1}^{n}(y_i – \overline{y})^2 = (10 – 50.29)^2 + (16 – 50.29)^2 + \ldots + (82 – 50.29)^2\)
\( 1612.84 + 1178.41 + \ldots + 1003.61\Rightarrow 6200.86\)
\(s_y = \sqrt{\frac{6200.86}{7 – 1}} = 32.09\)
Calculating \(s_x\) :
\(\sum_{i=1}^{n}(x_i – \overline{x})^2 = (2 – 22.29)^2 + (5 – 22.29)^2 + \ldots + (42 – 22.29)^2 \)
\(= 412.84 + 296.41 + \ldots + 400.41\Rightarrow 1600.86\)
\(s_x = \sqrt{\frac{1600.86}{7 – 1}} = 16.41\)
\(a = r \cdot \frac{s_y}{s_x}\Rightarrow a = 0.991 \cdot \frac{32.09}{16.41}\Rightarrow a = 1.94$$ (rounded to three significant figures)\)
Step 3: Calculate the y-intercept (b) using the formula:
\(b = \overline{y} – a \cdot \overline{x}\Rightarrow b = 50.29 – 1.94 \cdot 22.29\Rightarrow b = 7.22 (rounded to three significant figures)\)
Therefore, the equation of the regression line is: h = 1.94d + 7.22
(b) attempt to substitute d = 20 into their equation
height = 45.8683…
height = 45.9 (cm)
We can substitute d = 20 into the regression line equation we obtained in part (a):
h = 1.94d + 7.22
Substituting d = 20, we get:
h = 1.94(20) + 7.22
h = 45.8683…
height = 45.9 cm
Therefore, using the regression line, the estimated average height of the plants when the experiment has been running for 20 days is approximately 45.9 cm.
Question
Topic:Geometry and trigonometry
Given: Two buildings of different heights stand on a level ground. The taller building has a height of h metres. The shorter building has an unknown height. A person stands on the ground at a point that is equidistant from both buildings. The person looks up at the tops of both buildings and measures the same angle of elevation, θ. The person also measures the distances from their position to the tops of both buildings, and the horizontal distance between the tops of both buildings.

The measurements are as follows:
- Distance from person to top of taller building: 150 m
- Distance from person to top of shorter building: 90 m
- Horizontal distance between tops of both buildings: 154 m
Calculate: What is the value of h, the height of the taller building?
▶️Answer/Explanation
METHOD 1
attempt to substitute into cosine rule
\(\hat{APB} = 75.2286…^o\) OR 1.31298… radians
\(\hat{APB} = 75.2^o\) OR 1.31 radians
valid approach to find \(\theta \)
\(\theta = \frac{180^0 – \hat{APB}}{2}\) OR \(\theta = \frac{180^0 – 75.2286…^o}{2}\) (=52.3856…) OR
\(\theta = \frac{\pi – 1.31298…}{2}\) (=0.914302…)
valid approach to express h in terms of θ
sin θ = \(\frac{h}{150}\) OR h = 150sin 52.3856…\(^o\)
h = 118.820
h = 119 (m)