Question
Different polysaccharides are used by plants for energy storage and structural support. The molecular structures for two common polysaccharides are shown in Figure 1. Starch is used by plants for energy storage, and cellulose provides structural support for cell walls. The monomer used to construct both molecules is glucose.

A study determined the effect of two different digestive enzymes, A and B, on these two polysaccharides. Table 1 presents the data from the study.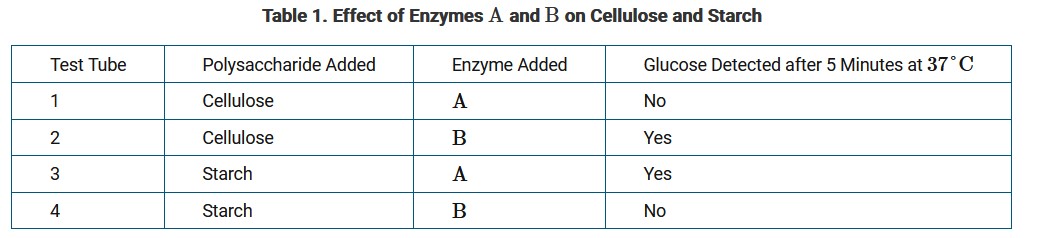
Mammals do not produce digestive enzyme B. However, sheep and cattle are two types of mammals that contain microorganisms in their digestive tract that produce enzyme B.
Based on Figure 1, which of the following best compares the atomic structures of starch and cellulose?
A. Starch is composed of carbon, hydrogen, and oxygen, while cellulose also contains nitrogen.
B. Starch and cellulose are composed of repeating glucose monomers; however, in cellulose every other glucose monomer is rotated 180 degrees.
C. Starch is composed of monomers that each have a \(CH_2OH\) group, while cellulose only has a \(CH_2OH\) group on every other monomer.
D. Starch and cellulose are composed of identical monomers and therefore have identical structures.
Answer/Explanation
Ans: B
Both starch and cellulose are both composed of repeating glucose molecules; however, the orientation of every other glucose in cellulose is upside down compared with the ones on either side.
Question
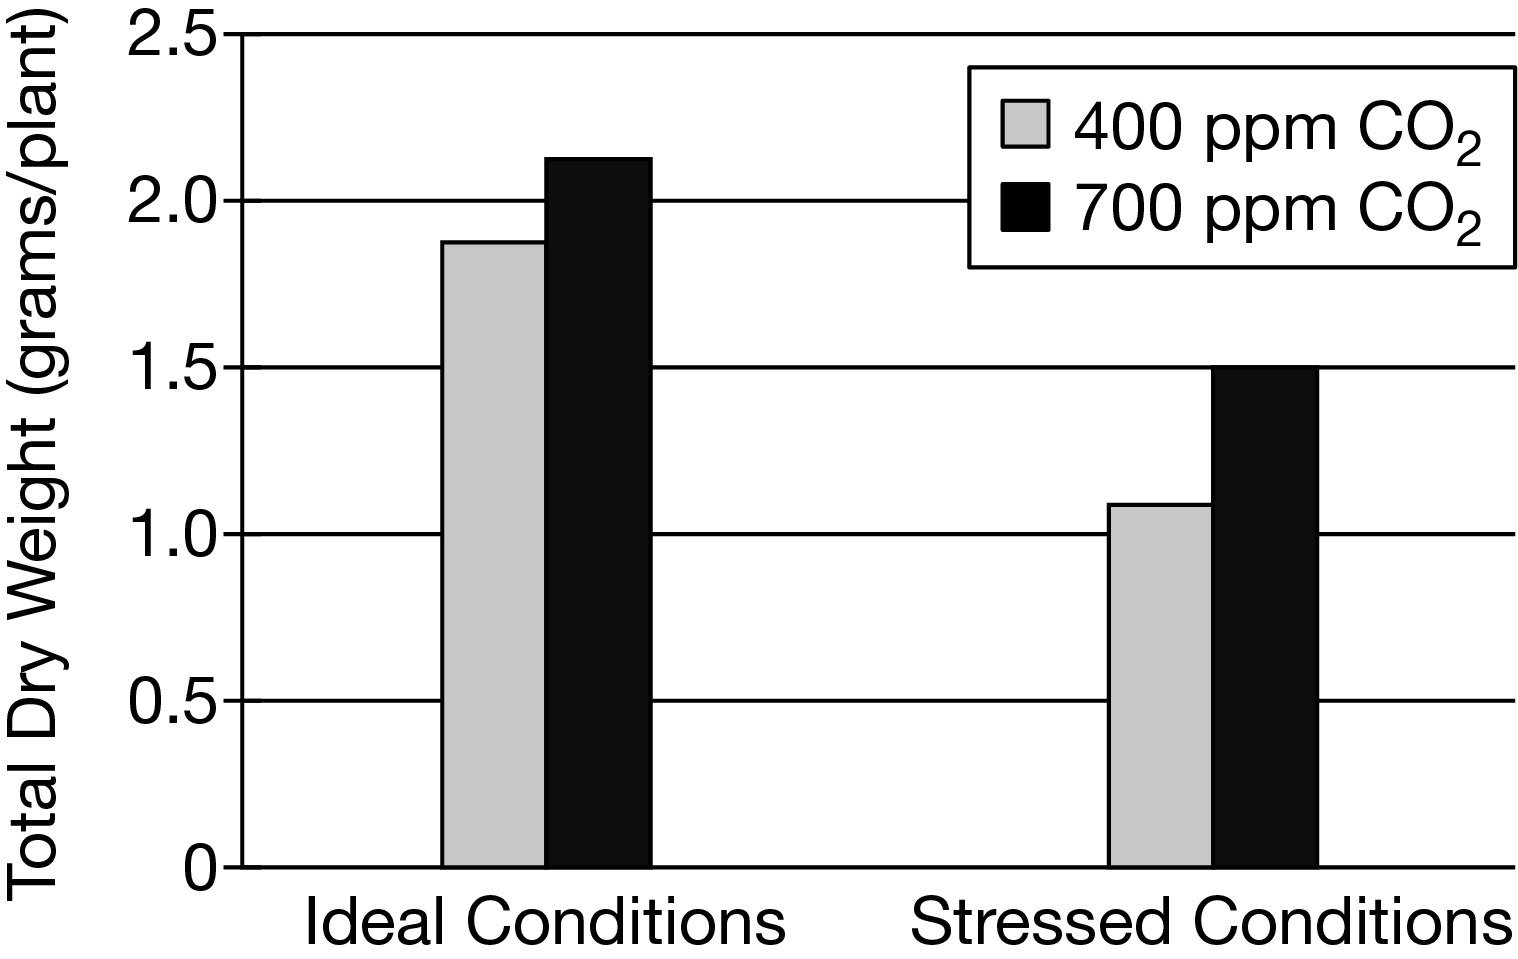
The figure shows the results of an experiment to investigate the effects of an enriched \(CO_2\) environment on plant growth. Identical plants were separated into different groups and grown either in a standard \(CO_2\) environment (400 ppm \(CO_2\)) or in an enriched \(CO_2\) environment (700 ppm \(CO_2\)). Of the plants in each environment, half were grown under ideal conditions and half were grown under stressed conditions.
Based on the figure, which statement best describes the observed relationship between atmospheric CO2 enrichment and plant growth under ideal and stressed conditions?
Answer/Explanation
Ans: C
Based on the figure, the increase in atmospheric CO2 resulted in a greater increase in plant growth under stressed conditions than under ideal conditions.
Question
The figure shows the results of an experiment to investigate the effects of an enriched \(CO_2\) environment on plant growth. Identical plants were separated into different groups and grown either in a standard \(CO_2\) environment (400 ppm \(CO_2\)) or in an enriched \(CO_2\) environment (700 ppm \(CO_2\)). Of the plants in each environment, half were grown under ideal conditions and half were grown under stressed conditions.
Based on the figure, which statement best describes the observed relationship between atmospheric CO2 enrichment and plant growth under ideal and stressed conditions?
▶️Answer/Explanation
Answer: C. The increase in atmospheric \(CO_2\) resulted in a greater increase in plant growth under stressed conditions than under ideal conditions.
Explanation:
• Carbon dioxide \(CO_2\) is a reactant in photosynthesis, the process by which plants make their food. Increasing \(CO_2\) can increase the rate of photosynthesis, which may lead to more growth.
• The bar graph shows total dry weight, which indicates plant growth. In both conditions, increasing \(CO_2\) leads to more growth, but the increase is larger under stressed conditions. This means the \(CO_2\) enrichment helped plants compensate more when conditions were poor.
Answer Evaluation:
A. Incorrect – There is an observable effect; in both conditions, higher \(CO_2\) led to more growth.
B. Incorrect – The increase in plant growth under stressed conditions was greater, not under ideal conditions.
C. Correct – The increase in \(CO_2\) caused a larger improvement in growth under stressed conditions compared to ideal ones.
D. Incorrect – Growth was enhanced, not inhibited, by the \(CO_2\) increase.
Question
Phosphorous (P) is an important nutrient for plant growth. Figure 1 shows Arabidopsis thaliana plants grown under phosphorus‐sufficient (left) and phosphorus‐starved (right) conditions for six weeks.

Figure 1. Arabidopsis thaliana plants grown for six weeks.
Answer/Explanation
Ans: C
Phosphorus is used to make nucleic acids and certain lipids. Without phosphorus atoms, nucleic acids and lipids cannot be made for the plant to use for growth.