Question
Refer to the following data.
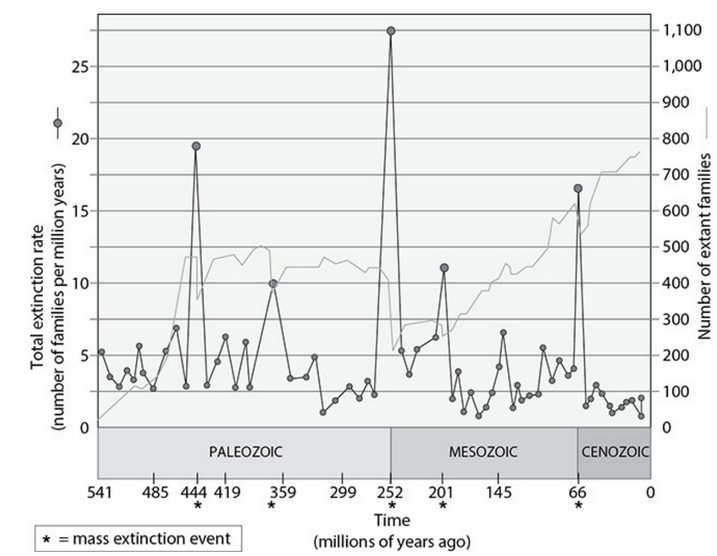
The end-Permian mass extinction (252 million years ago) resulted in
the extinction of approximately 96% of marine species. Explain how
this can be true even though the light-grey line on the graph shows
only a 50% drop at that time.
▶️Answer/Explanation
Ans:
Before we construct an answer, let’s make sure we understand what the
graph is saying. There are two lines that tell a similar story: The dark grey
line indicates the total extinction rate in number of families per million
years and the light grey line indicates the number of extant families. The
large peak in the dark grey line (the extinction rate) at 252 million years
shows a rise from about a 2.5 families per million years to about 27.5
families per million years, an increase of 25 families per million years. The
light grey line shows that the number of extant (not extinct) families
declined from about 400 families to about 200 families, a 50% drop.
In taxonomic terms, a family contains one or more genera and each
genera contains one or more species. So a family can contain a minimum of
one species but can contain a large number of species. For example, the
Coccinellidae family of beetles (commonly known as the ladybug beetles)
contains approximately 6,000 species of beetles. Only one species of the
family has to survive in order for the family toalone can account for the apparent discrepancy in the number of families
declining by 50% but the number of species declining by 96%.
Another less important but still significant issue that could cause the
apparent discrepancy is that the lost 96% of species were marine. By 252
million years ago, there were many terrestrial and freshwater species as
well. remain extant. That
Question
The presumed ancestor of all placental mammals is thought to be a furry ailed tree-climber and insect eater that weighed between 6 and 245 grams. It had a highly folded brain and three pairs of molars on each jaw. The placental mammals are believed to have diversified after the K/T extinction. No one has ever found fossils of placental mammals from before the K/T extinction event 65 million years ago. Genetic studies, however, place the origin of the placental mammals at 100 million years ago.
Did placental mammals first appear before or after the K/T extinction? State the type of data that would convincingly support each of the two
alternate hypotheses. Include a description of what would need to be measured or observed and the expected difference between pre-
extinction and post-extinction diversification.
▶️Answer/Explanation
Ans:
The lack of fossils is not as strong evidence that something didn’t
exist in a particular time or area than the (having) of fossil evidence is to support that they were at a particular time and place or coexisted
with other species. The genetic data are not “bulletproof.” Data to support
pre-extinction diversification would be the existence of several fossils of
diverse mammals dated over 65 million years ago.
Molecular clocks may need different calibration for different
organisms. Large body size and long generation times, for example, tend
to slow the molecular clock. This is because the same period of time has
fewer generations for a longer-lived organism, so not as many
replications and mutations would have occurred in gametes. See
answers 6 and 94 for more information on molecular clocks.
Evidence that would support post-extinction diversification is a new
piece of information that recalibrated the molecular data to place the
diversification earlier than 100 million years ago. Observations that support,
but are not technically evidence, would be the continued failure to find
older placental mammal fossils and the construction of a phylogeny (based
on additional fossil discoveries) that completely explains the data without
the requirement of a pre-extinction diversification event.
