▶️ Answer/Explanation
Question
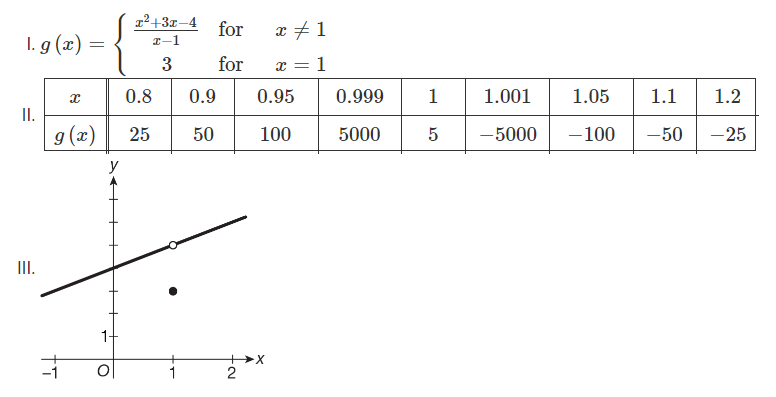
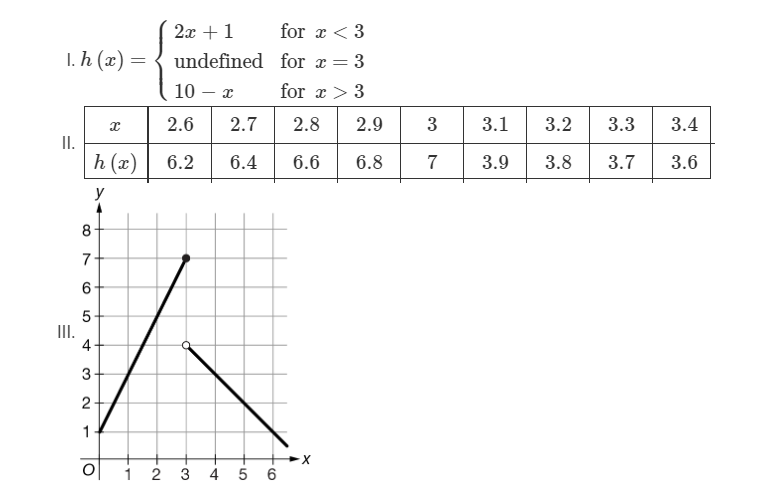
If h is a piecewise linear function such that \(\lim_{x \to 3}h(x)\) does not exist, which of the following could represent the function h ?
A I Only
B II only
C III only
D I and III only
▶️Answer/Explanation
Ans:D
The table in (II) could represent the function h. The data in the table for x<3 are linear with slope 2, so the limit as x approaches 3 from the left would be 7. The data in the table for x>3 are also linear with slope −1, so the limit as x approaches 3 from the right would be 4. Since the left- and right-hand limits are not equal, the limit at x=3 would not exist for the function represented by this table.
The graph in (III) could also represent the function h, since the graph shows a jump discontinuity at x=3, where the left- and right-hand limits are unequal. The values in the table in (II) are the same as the values on this graph.
The expression in (I) could not represent the function h, since \(\lim_{x \to 3^-}(2x+1) =7\) and \(\lim_{x \to 3^+}(10-x) =7\) implies that the limit of the expression in (I) exists at x=3.
Question
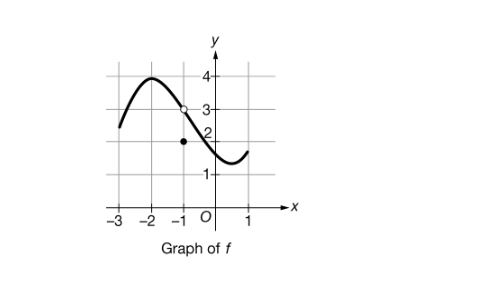
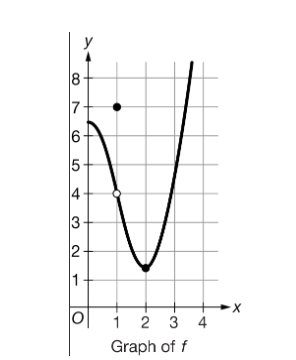
The graph of the function f is shown above. Which of the following could be a table of values for f ?
A 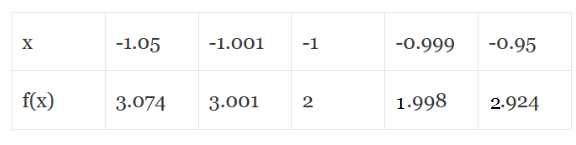
B 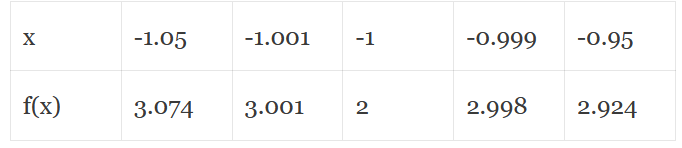
C 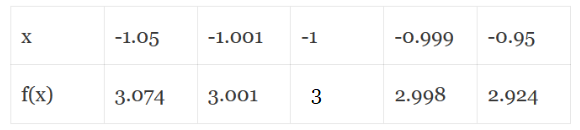
D 
▶️Answer/Explanation
Ans:B
The graph of \(f \) shows that \(\lim_{x \to -1}f(x) =3\) and f(−1)=2. This table is consistent with that information.
Question
The graph of the function \(f\) is shown above. Which of the following could be a table of values for \(f\)?
A 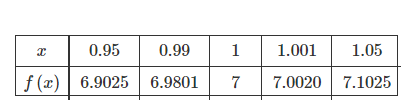
B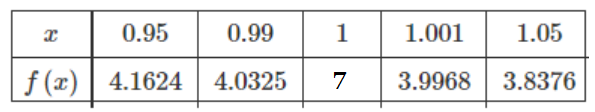
C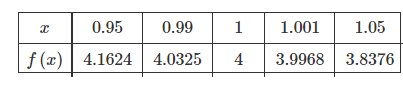
D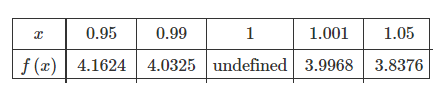
▶️Answer/Explanation
Ans:B
The graph of f shows that \(\lim_{x \to 1}f(x) =4\) and f(1)=7. This table is consistent with that information.