Question
Which of the following graphs is the solution to the logistic differential equation \(\frac{\mathrm{d} y}{\mathrm{d} x}=\frac{y}{5}(1-\frac{y}{50})\) with the initial condition y(0) = 100 ?
A 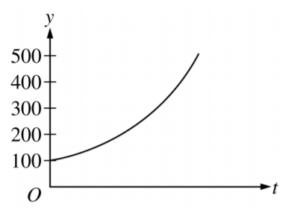
B 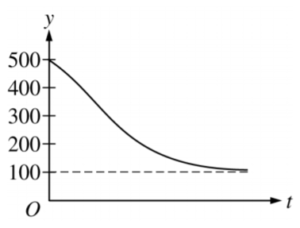
C 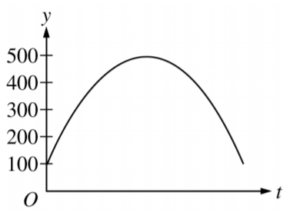
D 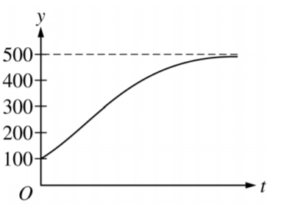
Answer/Explanation
Question
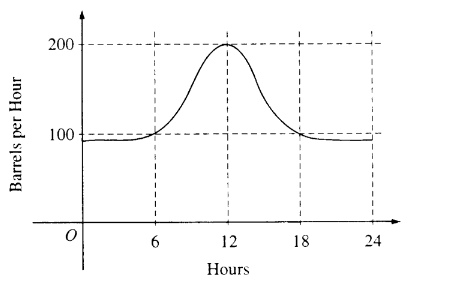
The flow of oil, in barrels per hour, through a pipeline on July 9 is given by the graph shown above. Of the following, which best approximates the total number of barrels of oil that passed through the pipeline that day?
(A) 500 (B) 600 (C) 2,400 (D) 3,000 (E) 4,800
Answer/Explanation
Ans:D
Question
The population P ( t) of a species satisfies the logistic differential equation \(\frac{dp}{dt}=P\left ( 2-\frac{P}{5000} \right )\), where the initial population P(0) = 3,000 and t is the time in years. What is \( \lim_{t\rightarrow\infty }P(t)\) ?
(A) 2,500 (B) 3,000 (C) 4,200 (D) 5,000 (E) 10,000
Answer/Explanation
Ans:E
As\( lim_{t\rightarrow \infty }\frac{dP}{dt}=0\) for a population satisfying a logistic differential equation, this means that
Question
Let y=f(x) be the solution to the differential equation \(\frac{dy}{dx}=1+2y\) with the initial condition f (0)=1 What is the approximation for f (1) if Euler’s method is used, starting at with a step size of 0.5?
(A)2.5
(B)3.5
(C)4.0
(D)5.5
