AP Chemistry 3.11 Spectroscopy and the Electromagnetic Spectrum - FRQs- New Syllabus
Question
Step \( 2 \): Rinse the cuvette with distilled water.
Step \( 3 \): Rinse the cuvette with the standard solution and fill the cuvette with the standard solution.
Step \( 4 \): Measure the absorbance of the standard solution with the colorimeter.
Step \( 5 \): Repeat steps \( 2 \)-\( 4 \) for each of the standard solutions.
Most-appropriate topic codes (AP Chemistry):
• Topic \( 3.13 \) — Beer-Lambert Law (Part \( \mathrm{(c)} \))
• Topic \( 3.7 \) — Solutions and Mixtures (Part \( \mathrm{(b)(ii)} \), Part \( \mathrm{(c)} \))
• Topic \( 2.3 \) — Structure of Ionic Solids (Part \( \mathrm{(b)(i)} \), reading measurement from lab glassware)
▶️ Answer/Explanation
(a)
For the correct answer:
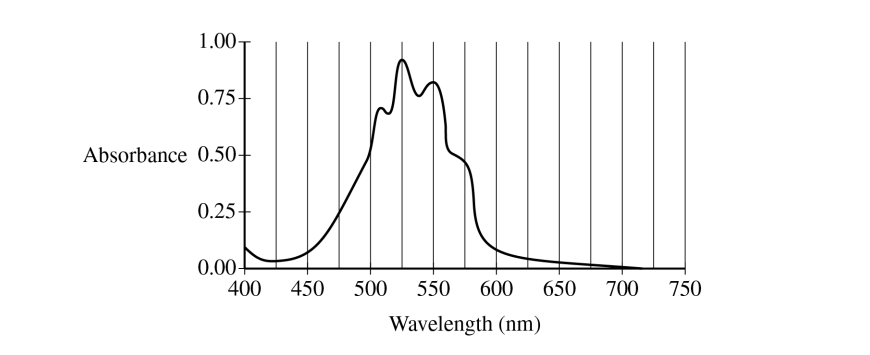
\( 525\ \mathrm{nm} \)
The best wavelength is the one with the highest absorbance, because that gives the strongest signal and the most sensitive concentration measurement.
(b)(i)
For the correct answer:
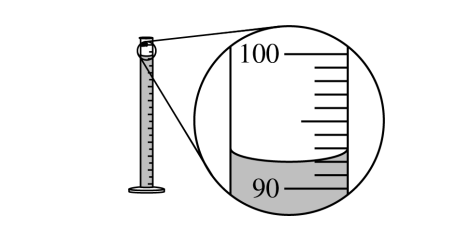
\( 92.0\ \mathrm{mL} \)
The liquid level should be read at the bottom of the meniscus. In the magnified scale, the meniscus is at \( 92.0\ \mathrm{mL} \).
(b)(ii)
For the correct calculated value:
\( V_1 = \dfrac{M_2V_2}{M_1} = \dfrac{(1.68 \times 10^{-3}\ \mathrm{M})(100.0\ \mathrm{mL})}{2.40 \times 10^{-3}\ \mathrm{M}} = 70.0\ \mathrm{mL} \)
This is a dilution problem, so use \( M_1V_1 = M_2V_2 \).
Therefore, the required stock-solution volume is \( \boxed{70.0\ \mathrm{mL}} \).
(c)
For the correct answer and a valid justification:
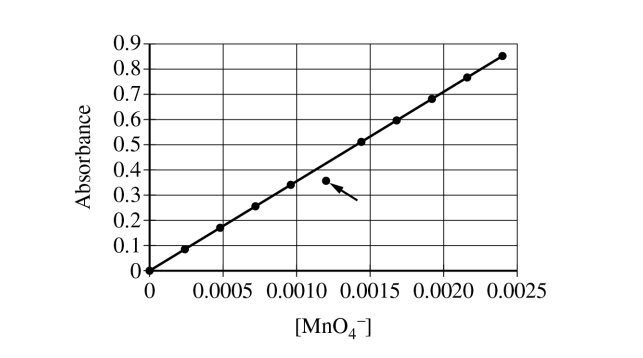
The student could have improperly executed step \( 3 \). If the cuvette was not rinsed with the standard solution prior to being filled for the measurement of absorbance, the standard solution would be diluted by the remaining distilled water, and the absorbance would be lower than what it should be.
Since the marked point is below the best-fit line, its measured absorbance is too small for its stated concentration. A little leftover water in the cuvette would cause exactly that.