Question (12 points, suggested time 25 minutes)

A group of students is investigating how the thickness of a plastic rod affects the maximum force Fmax with which the rod can be pulled without breaking. Two students are discussing models to represent how Fmax depends on rod thickness.
Student A claims that Fmax is directly proportional to the radius of the rod.
Student B claims that Fmax is directly proportional to the cross-sectional area of the rod—the area of the base of the cylinder, shaded gray in the figure above.
(a) The students have a collection of many rods of the same material. The rods are all the same length but come in a range of six different thicknesses. Design an experimental procedure to determine which student’s model, if either, correctly represents how Fmax depends on rod thickness. In the table below, list the quantities that would be measured in your experiment. Define a symbol to represent each quantity, and also list the equipment that would be used to measure each quantity. You do not need to fill in every row. If you need additional rows, you may add them to the space just below the table.
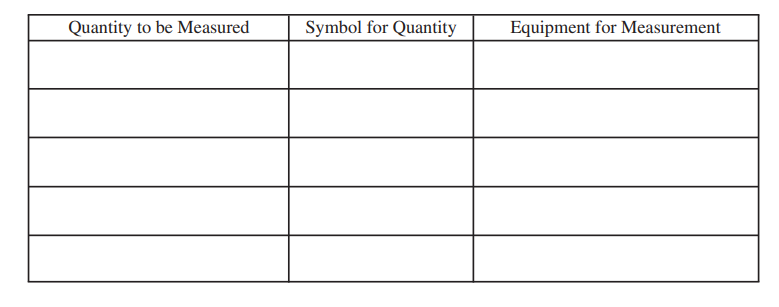
Describe the overall procedure to be used, referring to the table. Provide enough detail so that another student could replicate the experiment, including any steps necessary to reduce experimental uncertainty. As needed, use the symbols defined in the table and/or include a simple diagram of the setup.
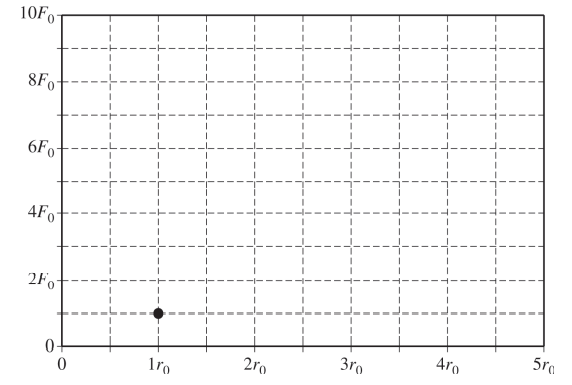
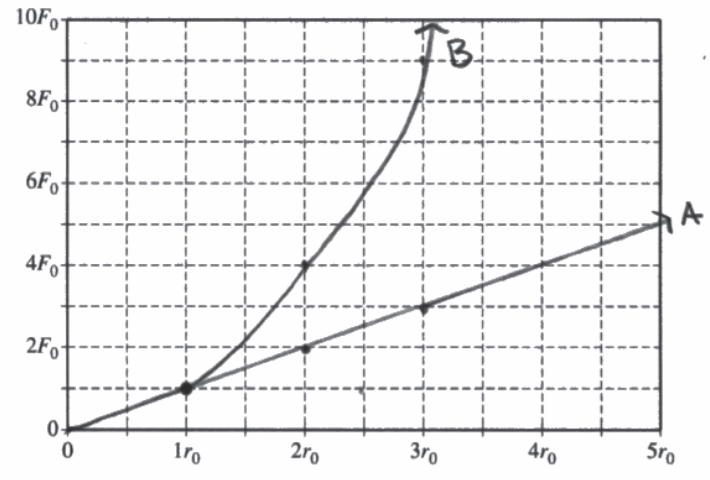
(b) For a rod of radius r0, it is determined that Fmax is F0, as indicated by the dot on the grid below. On the grid, draw and label graphs corresponding to the two students’ models of the dependence of Fmax on rod radius. Clearly label each graph “A” or “B,” corresponding to the appropriate model.
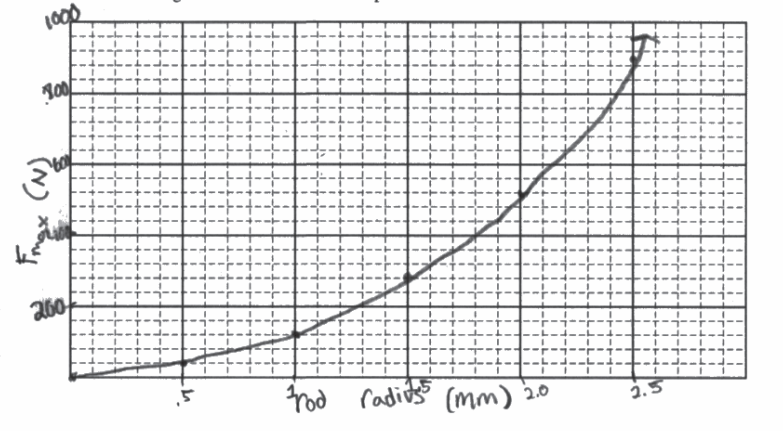
The table below shows results of measurements taken by another group of students for rods of different thicknesses.
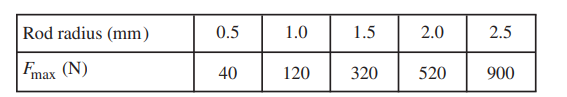
(c) On the grid below, plot the data points from the table. Clearly scale and label all axes, including units. Draw either a straight line or a curve that best represents the data.

(d) Which student’s model is more closely represented by the evidence shown in the graph you drew in part (c) ?
____ Student A’s model: Fmax is directly proportional to the radius of the rod.
____ Student B’s model: Fmax is directly proportional to the cross-sectional area of the rod. Explain your reasoning.
▶️Answer/Explanation
Ans:
(a)
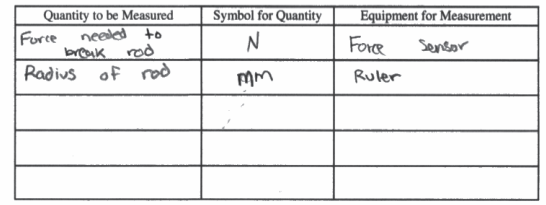
1) Students would measure radius of rod and calevlate the cross section from this.
2) Students would connect force sensor to one end of rod and pull until rod breaks. Record Nos. Repeat with rod of same thicknes,
3) Repeat steps I & Q with Rods of different material to reduce experimental uncertainty.
4) Students will then graph average N and r to Find the line of best Fit and analyze.

(b)
(c)
(d)
Student B claims Fmax is directly proportional r2. Fmax & r2 ‘s relationship would not be linear as shown in the graph.