Question
In the graphs that follow, a curve is drawn in the first graph of each pair. For the other graph in each pair, sketch the curve showing the relationship between the quantities labeled on the axes. Your graph should be consistent with the first graph in the pair.
▶️Answer/Explanation
Ans:
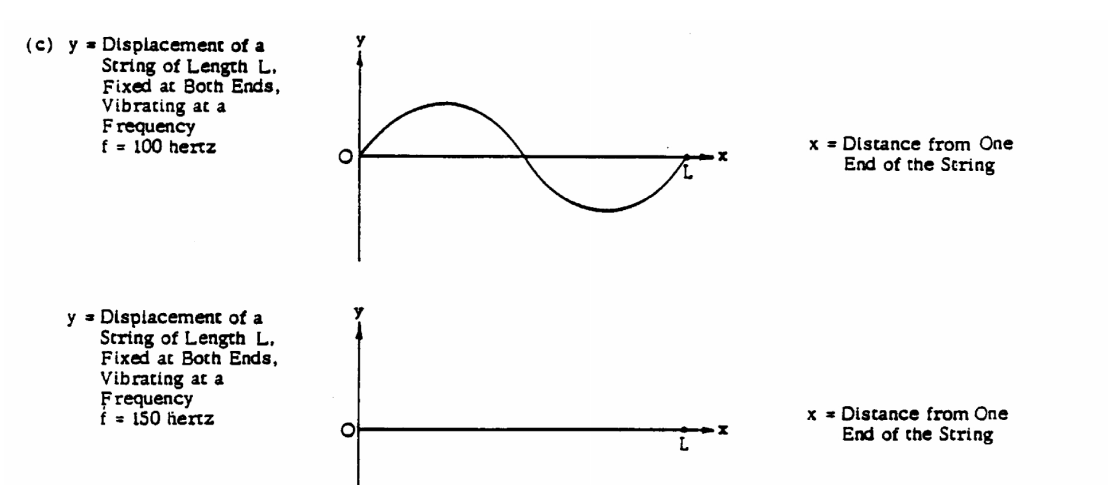
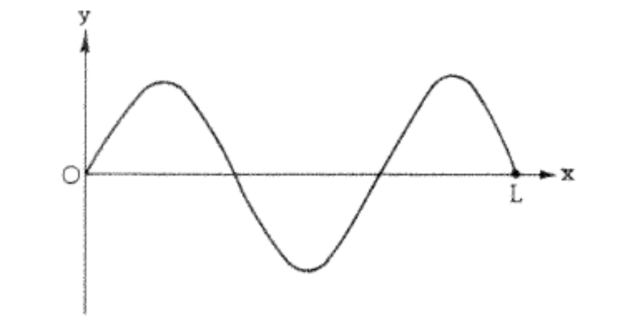
c) simple graph with 1.5x the frequency
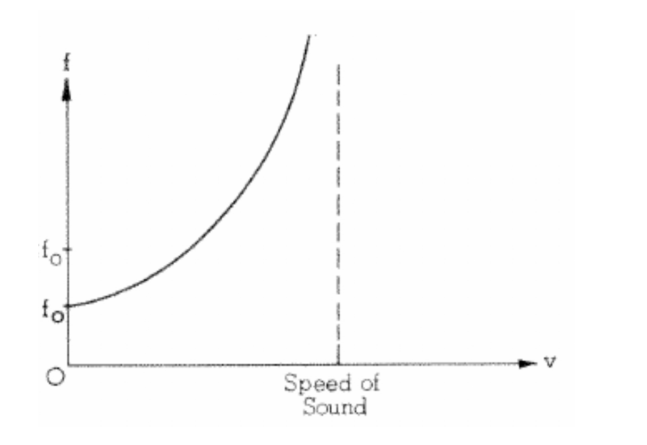
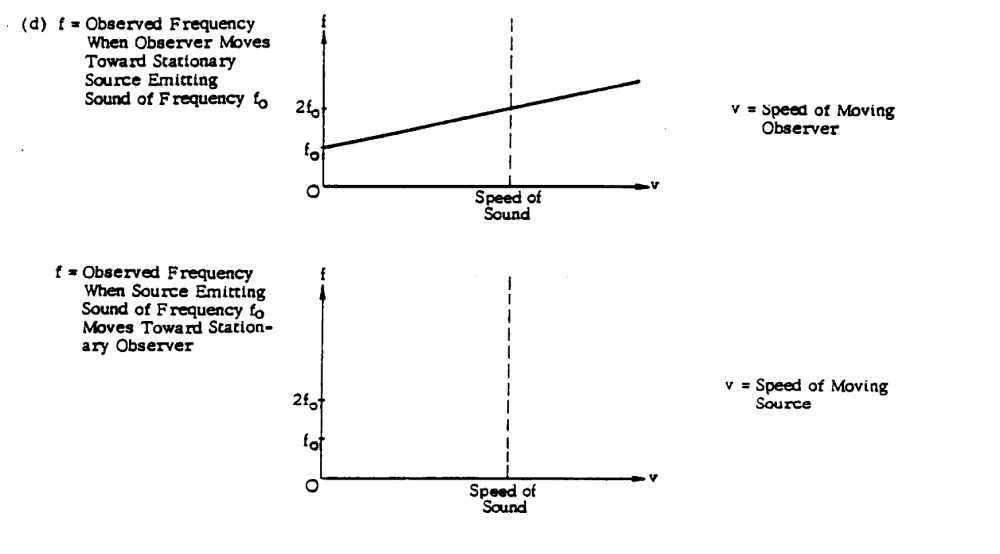
d) Graphs are based on the Doppler equation. The graph given in the problem is for a moving observer. Which is based on ƒ’ = ƒ\(\frac{(v_{snd}+v_{obs})}{v^{snd}}\). As the observer’s velocity increases, the frequency increases linearly with it as is shown in the problem
The new graph is based on a source moving towards you. ƒ’ = ƒ \(\frac{v_{snd}}{(v^{snd}-v_{source})}\). As can be seed from this equation, as the source increases velocity, the frequency increases but when the source approaches the speed of sound, the frequency approaches ∞ and becomes undefined so has a limit to it unlike in the first graph.