Question
Directions: Show all your work. Indicate clearly the methods you use, because you will be scored on the correctness of your methods as well as on the accuracy and completeness of your results and explanations.
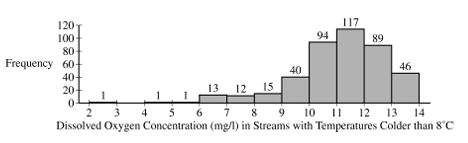
As part of a study on the chemistry of Alaskan streams, researchers took water samples from many streams with temperatures colder than \(8^{\circ} \mathrm{C}\) and from many streams with temperatures warmer than \(8^{\circ} \mathrm{C}\). For each sample, the researchers measured the dissolved oxygen concentration, in milligrams per liter (mg/l).
Dissolved Oxygen Concentration \((\mathrm{mg} / \mathrm{l})\) in Streams with Temperatures Colder than \(8^{\circ} \mathrm{C}\)
(a) The researchers constructed the histogram shown for the dissolved oxygen concentration in streams from the sample with water temperatures colder than \(8^{\circ} \mathrm{C}\). Based on the histogram, describe the distribution of dissolved oxygen concentration in streams with water temperatures colder than \(8^{\circ} \mathrm{C}\)
 .
.
(b) The researchers computed the summary statistics shown in the table for the dissolved oxygen concentration in streams from the sample with water temperatures warmer than \(8^{\circ} \mathrm{C}\). Use the summary statistics to construct a box plot for the dissolved oxygen concentration in streams with water temperatures warmer than \(8^{\circ} \mathrm{C}\). Do not indicate outliers.

(c) The researchers believe that streams with higher dissolved oxygen concentration are generally healthier for wildlife. Which streams are generally healthier for wildlife, those with water temperature colder than \(8^{\circ} \mathrm{C}\) or those with water temperature warmer than \(8^{\circ} \mathrm{C}\) ? Using characteristics of the distribution of dissolved oxygen concentration for temperatures colder than \(8^{\circ} \mathrm{C}\) and characteristics of the distribution of dissolved oxygen concentration for temperatures warmer than \(8^{\circ} \mathrm{C}\), justify your answer.
▶️Answer/Explanation
Ans:
(a) The distribution of dissolved oxygen concentration in streams with water temperatures colder than \(8^{\circ} \mathrm{C}\) is skewed to the left, with a median between 11 and \(12 \mathrm{mg} / 1\), a range between \(10 \times 12 \mathrm{mg} / \mathrm{l}\), and a possible outlier between 2 and \(3 \mathrm{mg} / 1\).
(b)

(C) Streams with water temperatures colder than \(8^{\circ} \mathrm{C}\) are generally healthier for wildlife because the median oxygen concentration for the distribution of temperatures from streams less than \(8^{\circ}\) is between 11 and \(12 \mathrm{mg} / 1\), which is greater than the median of \(5.43 \mathrm{mg} / 1\) for streams warmer than \(8^{\circ}\). In addition, 75\% of the streams with temperatures warmer than \(8^{\circ} \mathrm{C}\) are less than \(6.12 \mathrm{mg} / \mathrm{l}\) but in streams with temperatures colder than \(8^{\circ} \mathrm{C}\) at least \(413 / 429=96.3 \%\). are greater than \(6.12 \mathrm{mg} / 1\).
Question
A jewelry company uses a machine to apply a coating of gold on a certain style of necklace. The amount of gold applied to a necklace is approximately normally distributed. When the machine is working properly, the amount of gold applied to a necklace has a mean of 300 milligrams \((\mathrm{mg})\) and standard deviation of \(5 \mathrm{mg}\).
(a) A necklace is randomly selected from the necklaces produced by the machine. Assuming that the machine is working properly, calculate the probability that the amount of gold applied to the necklace is between \(296 \mathrm{mg}\) and \(304 \mathrm{mg}\).
The jewelry company wants to make sure the machine is working properly. Each day, Cleo, a statistician at the jewelry company, will take a random sample of the necklaces produced that day. Each selected necklace will be melted down and the amount of the gold applied to that necklace will be determined. Because a necklace must be destroyed to determine the amount of gold that was applied, Cleo will use random samples of size \(n=2\) necklaces.
Cleo starts by considering the mean amount of gold being applied to the necklaces. After Cleo takes a random sample of \(n=2\) necklaces, she computes the sample mean amount of gold applied to the two necklaces.
(b) Suppose the machine is working properly with a population mean amount of gold being applied of \(300 \mathrm{mg}\) and a population standard deviation of \(5 \mathrm{mg}\).
(i) Calculate the probability that the sample mean amount of gold applied to a random sample of \(n=2\) necklaces will be greater than \(303 \mathrm{mg}\).
(ii) Suppose Cleo took a random sample of \(n=2\) necklaces that resulted in a sample mean amount of gold applied of \(303 \mathrm{mg}\). Would that result indicate that the population mean amount of gold being applied by the machine is different from \(300 \mathrm{mg}\) ? Justify your answer without performing an inference procedure.
Now, Cleo will consider the variation in the amount of gold the machine applies to the necklaces. Because of the small sample size, \(n=2\), Cleo will use the sample range of the data for the two randomly selected necklaces, rather than the sample standard deviation.
Cleo will investigate the behavior of the range for samples of size \(n=2\). She will simulate the sampling distribution of the range of the amount of gold applied to two randomly sampled necklaces. Cleo generates 100,000 random samples of size \(n=2\) independent values from a normal distribution with mean \(\mu=300\) and standard deviation \(\sigma=5\). The range is calculated for the two observations in each sample. The simulated sampling distribution of the range is shown in Graph I. This process is repeated using \(\sigma=8\), as shown in Graph II, and again using \(\sigma=12\), as shown in Graph III.


(c) Use the information in the graphs to complete the following.
(i) Describe the sampling distribution of the sample range for random samples of size \(n=2\) from a normal distribution with standard deviation \(\sigma=5\), as shown in Graph I.
(ii) Describe how the sampling distribution of the sample range for samples of size \(n=2\) changes as the value of the population standard deviation \(\sigma\) increases.
Recall that Cleo needs to consider both the mean and standard deviation of the amount of gold applied to necklaces to determine whether the machine is working properly. Suppose that one month later, Cleo is again checking the machine to make sure it is working properly. Cleo takes a random sample of 2 necklaces and calculates the sample mean amount of gold applied as \(303 \mathrm{mg}\) and the sample range as \(10 \mathrm{mg}\).
(d) Recall that the machine is working properly if the amount of gold applied to the necklaces has a mean of \(300 \mathrm{mg}\) and standard deviation of \(5 \mathrm{mg}\).
(i) Consider Cleo’s range of \(10 \mathrm{mg}\) from the sample of size \(n=2\). If the machine is working properly with a standard deviation of \(5 \mathrm{mg}\), is a sample range of \(10 \mathrm{mg}\) unusual? Justify your answer.
(ii) Do Cleo’s sample mean of \(303 \mathrm{mg}\) and range of \(10 \mathrm{mg}\) indicate that the machine is not working properly? Explain your answer.
▶️Answer/Explanation
Ans:

\(\begin{aligned} & z=\frac{304-300}{5}=0.8 \\ & z=\frac{296-300}{5}=-0.8\end{aligned}\)
Area \(=0.7881-0.2119=0.5762\)

\(\begin{aligned} & z=\frac{303-300}{5 / \sqrt{2}}=0.85 \\ & \text { Area }=1-0.8023=0.1977\end{aligned}\)
(ii) No. Assuming the machine is working properly \((M=300)\), there is a \(0.1977 \times 2=0.3954\) probability of getting a sample mean of 303 or more extreme in either direction purely by chance. Because \(0.3954>0.05\) we do not have convincing evidence the mean amount of gold is different from \(300 \mathrm{mg}\).
(c)
(i) The distribution of sample range for random samples of size \(n=2\) from a normal distribution of amount of gold with standard deviation \(\sigma=5\) is skewed to the right, with a median between \(4.5 \mathrm{mg}\) a range of about \(28 \mathrm{mg}\) and no obvious outliers.
(ii) As the population standard deviation \(\sigma\) increases, the graphs become more skewed right and the medians and ranges increase.
(d)(i)
$
\begin{aligned}
P(\text { sample range } \geq 10) \approx & 0.04+0.03+0.02+0.02+0.02 \\
& +0.01+0.01+0.01+0.005+0.005 \\
\approx & 0.17
\end{aligned}
$
Assuming the machine is working properly \((\sigma=S)\), there is about a 0.17 probability of getting a sample range of 10 or higher purely by chance.
Because \(0.17>0.05\), this is not unusual.
(ii)
$
\begin{aligned}
& P(\bar{x} \geq 303 \text { or } \bar{x} \leq 297 \mid \mu=300)=0.3954 \\
& P(\text { sample range } \geq 10 \mid \sigma=5)=0.17 \\
& P(\bar{x} \geq 303 \text { or } \bar{x} \leq 297 \text { AND sample range } \geq 10 \mid \mu=300 * \sigma=5) \\
& =0.3954 \times 0.17=0.067
\end{aligned}
$
Assuming the machine is working properly \((\mu=300\) and \(\sigma=5)\) there is a 0.067 probability of getting Cleo’s result or more extreme purely by chance. Because \(0.007>0.05\) we do not have convincing evidence the machine is not working properly.