Question
Studies have shown that foods rich in compounds known as flavonoids help lower blood pressure. Researchers conducted a study to investigate whether there was a greater reduction in blood pressure for people who consumed dark chocolate, which contains flavonoids, than people who consumed white chocolate, which does not contain flavonoids. Twenty-five healthy adults agreed to participate in the study and add 3.5 ounces of chocolate to their daily diets. Of the 25 participants, 13 were randomly assigned to the dark chocolate group and the rest were assigned to the white chocolate group. All participants had their blood pressure recorded, in millimeters of mercury ( \(\mathrm{mmHg}\) ), before adding chocolate to their daily diets and again 30 days after adding chocolate to their daily diets.
The reduction in blood pressure (before minus after) for each of the participants in the two groups is shown in the dotplots below.
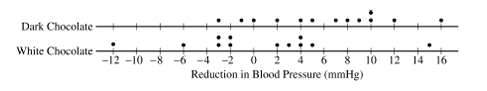
(a) Determine and compare the medians of the reduction in blood pressure for the two groups.
The researchers found the mean reduction in blood pressure for those who consumed dark chocolate is \(\bar{x}_{\text {dark }}=6.08 \mathrm{mmHg}\) and the mean reduction in blood pressure for those who consumed white chocolate is \(\bar{x}_{\text {white }}=0.42 \mathrm{mmHg}\).
(b) One researcher indicated that because the difference in sample means of \(5.66 \mathrm{mmHg}\) is greater than 0 there is convincing statistical evidence to conclude that the population mean blood pressure reduction for those who consume dark chocolate is greater than for those who consume white chocolate. Why might the researcher’s conclusion, based only on the difference in sample means of \(5.66 \mathrm{mmHg}\), not necessarily be true?
A simulation was conducted to investigate whether there is a greater reduction of blood pressure for those who consume dark chocolate than for those who consume white chocolate. The simulation was conducted under the assumption that no difference exists. The results of 120 trials of the simulation are shown in the following dotplot.
(c) Use the results of the simulation to determine whether the results from the 25 participants in the study provide convincing statistical evidence, at a 5 percent level of significance, that adding dark chocolate to a daily diet will result in a greater reduction in blood pressure, on average, than adding white chocolate to a daily diet. Justify your answer.
▶️Answer/Explanation
Ans:
(a) The median blood pressure reduckim is 1 for the doric Chocolate grove and 0 for the white Chocolate sue. The dart chocolate gran wis \(\partial\) higher median blood pressure reduction.
(b) you cannot conclude statistic significance based on sample means don. An appreciate hypothesis test must be conducted to decide whether or not “. lively the difference in Sample mean l was caused by random chance.
(b) You can not conclude statistics significance based on sample means alone. An appreciate hypothesis test must be conducted to decide whether or not o lively the difference in Sample mean l was caused by random chance.