Question
A medical researcher completed a study comparing an omega- 3 fatty acids supplement to a placebo in the treatment of irritability in patients with a certain medical condition. Nineteen patients with the medical condition volunteered to participate in the study. The study was conducted using the following weekly schedule.
- Week 1: Each patient took a randomly assigned treatment, omega-3 supplement or placebo.
- Week 2: The patients did not take either the omega- 3 supplement or the placebo. This was necessary to reduce the possibility of any carryover effect from the assigned treatment taken during week 1 .
- Week 3: Each patient took the treatment, omega-3 supplement or placebo, that they did not take during week 1 .
At the end of week 1 and week 3 , each patient’s irritability was given a score on a scale of 0 to 10 , with 0 representing no irritability and 10 representing the highest level of irritability.
For each patient, the two irritability scores and the difference in their scores (placebo minus omega-3) were recorded. The results are summarized in the table and boxplots.


The researcher claims the omega-3 supplement will decrease the mean irritability score of all patients with the medical condition similar to the volunteers who participated in the study. Is there convincing statistical evidence to support the researcher’s claim at a significance level of \(\alpha=0.05\) ? Complete the appropriate inference procedure to support your answer.
▶️Answer/Explanation
Ans:
(4) \(H_0: \mu_{\text {diff }}=0 \quad \mu_{\text {diff }}=\) true mean difference in irritability \(H_a: M_{\text {diff }}>0 \quad\) scores (place o-Omega 3). for all patients with the medical condition similar to volunteers in the study
One sample t-test for \(M_{\text {diff }}\) (matched pairs + test)
Conditions: – Random: The order of treatments was randomly assigned
– Normal/Large Sample: The boxpot of differences shows no strong skew or outliers
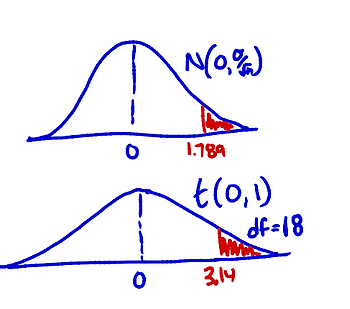
\(\begin{aligned} & \text { standardized }=\frac{\text { statistic }- \text { parameter }}{\text { test statistic }} \\ & t=\frac{\bar{x}_{\text {diff }}-M_{\text {diff }}}{s_{\text {diff }} / \sqrt{n}}=\frac{1.789-0}{2.485 / \sqrt{19}} \\ & t=3.14 \\ & P \text {-value }=0.0028\end{aligned}\)
Because 0.0028<0.05, we reject \(H_0\) and there is convincing evidence that the omega-3 supplement will decrease the mean irritability score of all patients with the medical condition similar to the volunteers that participated in the study.