AP Statistics – Unit 9: Inference for Quantitative Data: Slopes : MCQs Exam Style Practice Question and Answer

Question

Find the expected frequency of the cell marked with the ” “wn” in the following 3 \(\times 2\) table (the bold face values are the marginal totals):

a. 74.60

b. 18.12

c. 12.88

d. 19.65

e. 18.70

▶️Answer/Explanation

Ans:The correct answer is (c).

The expected value for that cell can be found as follows: \(\left(\frac{32}{77}\right)(31)=12.88\).

Question

A \(x^2\) goodness-of-fit test is performed on a random sample of 360 individuals to see if the number of birthdays each month is proportional to the number of days in the month. \(\mathrm{X}^2\) is determined to be 23.5 . The \(\mathrm{P}\)-value for this test is
a. \(0.001<P<0.005\)

b. \(0.02<P<0.025\)

c. \(0.025<\mathrm{P}<0.05\)

d. \(0.01<P<0.02\)

e. \(0.05<P<0.10\)

▶️Answer/Explanation

Ans: The correct answer is (d).

Since there are 12 months in a year, we have \(n=\) 12 and \(d f=12-1=11\). Reading from Table \(C, 0.01<P\)-value \(<0.02\). The exact value is given by the \(\mathrm{TI}-83 / 84\) as \(\mathrm{c}^2 \operatorname{cdf}(23.5,1000,11)=0.015\).

Question

Two random samples, one of high school teachers and one of college teachers, are selected and each sample is asked about their job satisfaction. Which of the following are appropriate null and alternative hypotheses for this situation?

a. \(\mathrm{H}_0\) : The proportion of each level of job satisfaction is the same for high school teachers and college teachers.
\(\mathrm{H}_{\mathrm{A}}\) : The proportions of teachers highly satisfied with their jobs is higher for college teachers.

b. \(\mathrm{H}_0\) : Teaching level and job satisfaction are independent. \(\mathrm{H}_{\mathrm{A}}\) : Teaching level and job satisfaction are not independent.

c. \(\mathrm{H}_0\) : Teaching level and job satisfaction are associated. \(\mathrm{H}_{\mathrm{A}}\) : Teaching level and job satisfaction are not associated.

d. \(\mathrm{H}_0\) : The proportion of each level of job satisfaction is the same for high school teachers and college teachers.
\(\mathrm{H}_{\mathrm{A}}\) : Not all of the proportions of each level of job satisfaction are the same for high school teachers and college teachers.

e. \(\mathrm{H}_0\) : Teaching level and job satisfaction are independent. \(\mathrm{H}_{\mathrm{A}}\) : Teaching level and job satisfaction are not associated.

▶️Answer/Explanation

Ans: The correct answer is (d).

Because we have independent random samples of teachers from each of the two levels, this is a test of homogeneity of proportions. It would have been a test of independence if there was only one sample broken into categories (correct answer would be (b) in that case).

Question

 A group separated into men and women are asked their preference toward certain types of television shows. The following table gives the results.

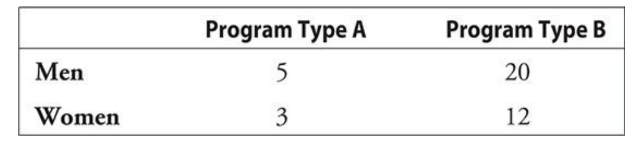
Which of the following statements is (are) true?
I. The variables gender and program preference are independent.

II. For these data, \(X^2=0\).

III. The variables gender and program preference are related.
a. I only

b. I and II only

c. II only

d. III only

e. II and III only

▶️Answer/Explanation

Ans:The correct answer is (b).

The expected values for the cells are exactly equal
$
\operatorname{Exp}=\left(\frac{25}{40}\right)(8)=5
$
to the observed values; e.g., for the 1 st row, 1 st column, so \(\mathrm{X}^2\) must equal \(0 \Rightarrow\) the variables are independent, and are not related.

Question

For the following two-way table, compute the value of \(X^2\).

a. 2.63

b. 1.22

c. 1.89

d. 2.04

e. 1.45

▶️Answer/Explanation

Ans:The correct answer is (e).

The expected values for this two-way table are given by the matrix: \(\left[\begin{array}{ll}12.5 & 27.5 \\ 12.5 & 27.5\end{array}\right]\).

Then,
$
\begin{aligned}
X^2= & \frac{(15-12.5)^2}{12.5}+\frac{(25-27.5)^2}{27.5}+\frac{(10-12.5)^2}{12.5} \\
& +\frac{(30-27.5)^2}{27.5}=1.45
\end{aligned}
$

Scroll to Top