▶️ Answer/Explanation
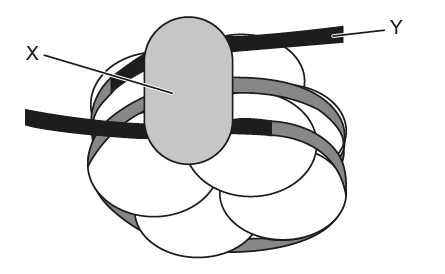
The diagram shows DNA wrapped around histone proteins to form nucleosomes. X represents the histone core, and Y represents the linker DNA connecting nucleosomes.
✅ Answer: (B)
✅ Answer: (B)
Question
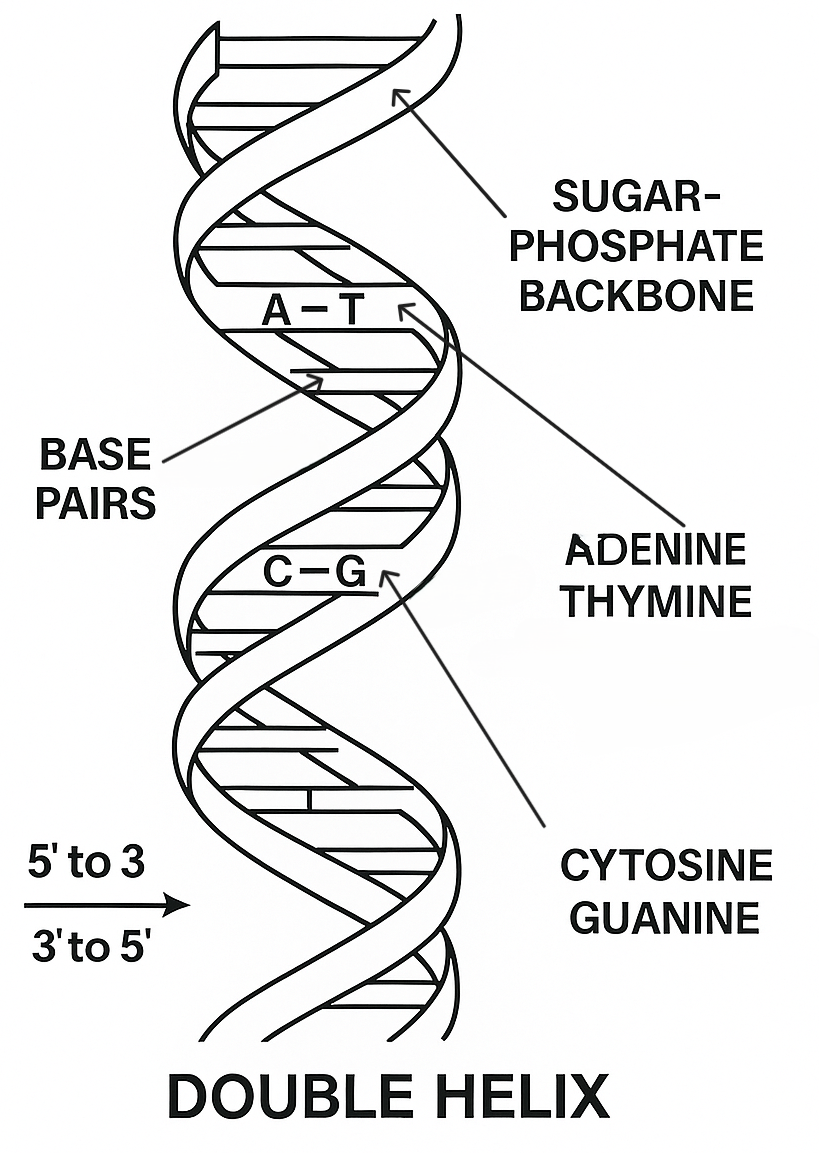
Watson and Crick worked out the three-dimensional structure of DNA.
What did the model they built show for the first time?
A. DNA is a polynucleotide.
B. DNA contains equal quantities of adenine and thymine.
C. DNA molecules have a helical shape.
D. DNA is a double helix with antiparallel sugar–phosphate backbones.
▶️Answer/Explanation
Answer: D. DNA is a double helix with antiparallel sugar phosphate backbones.
Explanation:
Watson and Crick’s model revealed DNA as a double helix with antiparallel sugar-phosphate backbones
Question
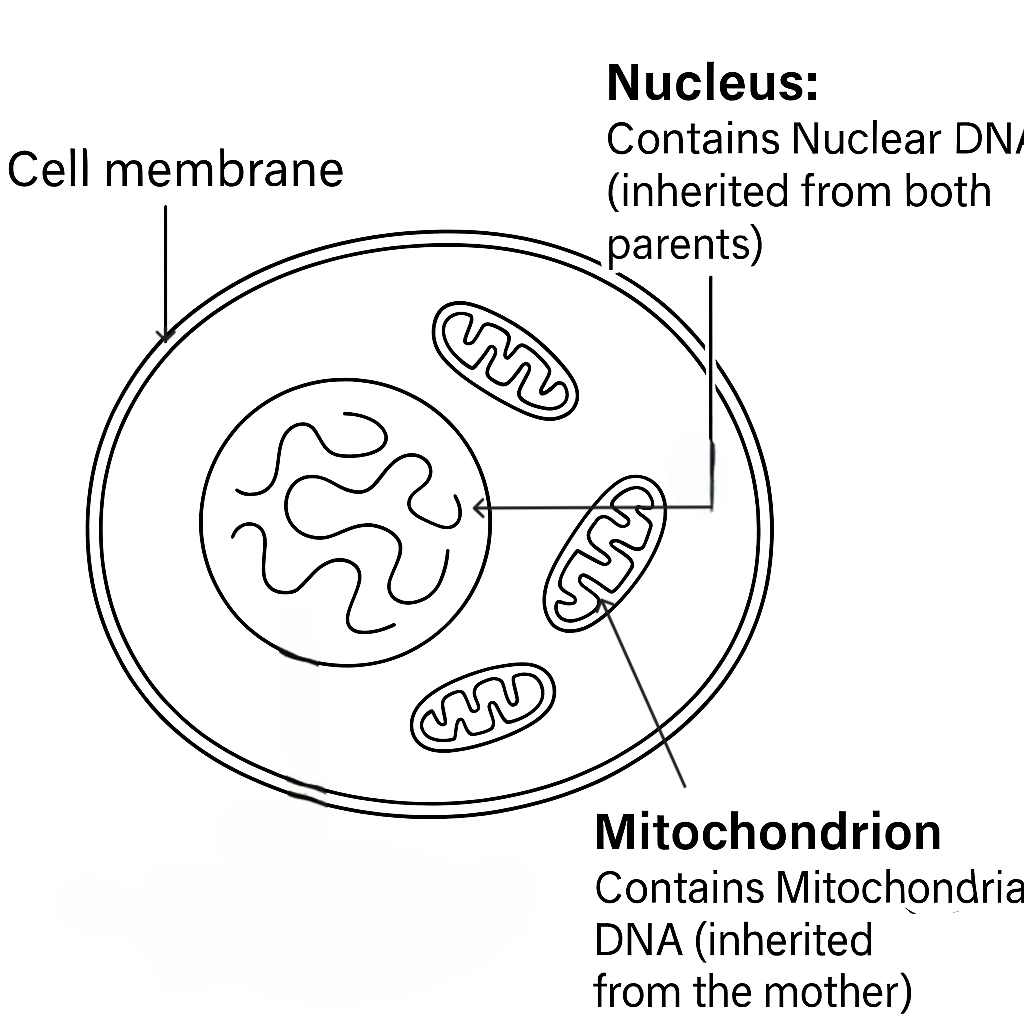
The Human Genome Project completed the sequencing of the human genome in 2003. What could have been a source for the entire human genome?
A. The contents of a red blood cell
B. The nucleus and mitochondria of a skin cell
C. The nucleus and acrosome of a sperm cell
D. The nucleus and ribosomes of any somatic cell
▶️Answer/Explanation
Answer: B. The nucleus and mitochondria of a skin cell.
Explanation:
The human genome includes both nuclear DNA (from chromosomes) and mitochondrial DNA (mtDNA). Skin cells contain both, while red blood cells lack DNA, sperm cells have haploid nuclear DNA, and ribosomes contain no DNA