Question
How does the endosymbiotic theory account for the origin of mitochondria in eukaryotic cells?
A. Autotrophic eukaryotes fused with photosynthetic bacteria.
B. Small aerobic bacteria survived inside anaerobic prokaryotes.
C. Anaerobic prokaryotes were engulfed by small aerobic bacteria.
D. Invaginations occurred in large prokaryotes to increase surface area for gas exchange.
▶️Answer/Explanation
Answer. B. Small aerobic bacteria survived inside anaerobic prokaryotes.
Explanation:
What is the Endosymbiotic Theory?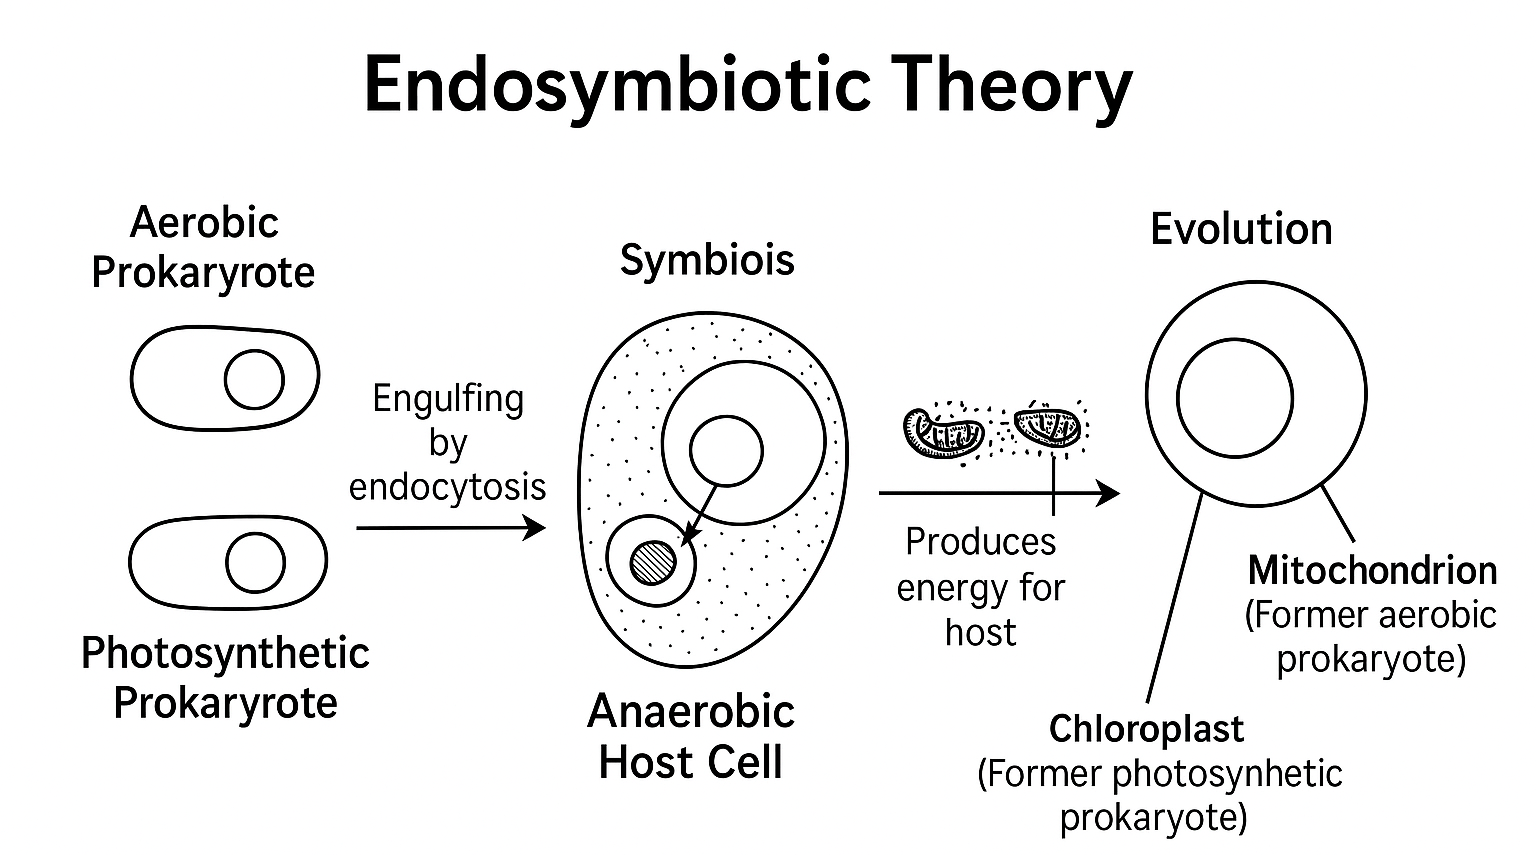
The endosymbiotic theory explains how eukaryotic cells (cells with nuclei and organelles) evolved from prokaryotic cells (simpler cells without a nucleus).
It specifically suggests that:
- Mitochondria (and chloroplasts in plants) originated from free-living prokaryotes.
- These were aerobic bacteria (used oxygen to make energy).
- They were engulfed by larger anaerobic cells (cells that didn’t use oxygen).
- Instead of being digested, the small aerobic bacteria lived inside the larger host and provided energy.
Over time, they formed a symbiotic relationship and became permanent organelles like mitochondria.
Now, let’s evaluate the options:
A. This relates more to chloroplasts, not mitochondria.
B. Yes! This directly describes mitochondria’s origin.
C. Backwards. The aerobic bacteria were engulfed.
D. That’s a different theory about membrane development, not mitochondria.
Question
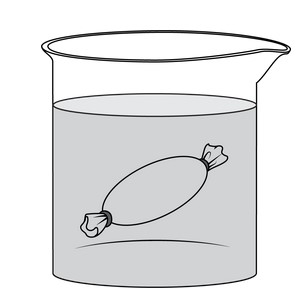
Figure 1
A student is using dialysis bags to model the effects of changing solute concentrations on cells. The student places one dialysis bag that contains 25 mL of distilled water into each of two beakers that are filled with 200 mL of distilled water. (Figure 1). The membrane of each dialysis bag membrane contains pores that allow small solutes such as monoatomic ions to pass through but are too small for anything larger to pass. After 30 minutes, 5 mL of a concentrated solution of albumin (a medium-sized, water-soluble protein) is added to one of the two beakers. Nothing is added to the other beaker. After two more hours at room temperature, the mass of each bag is determined. There is no change in the mass of the dialysis bag in the beaker to which no albumin was added.
Which of the graphs below best represents the predicted change in mass over time of the dialysis bag in the beaker to which albumin was added?
A.

B.

C.

D.

Answer/Explanation
Answer: B
Explanation:
Let’s break down why B is correct given the experimental setup:
Experiment Summary:
- Dialysis bag contents: 25 mL of distilled water.
- Beaker contents: 200 mL of distilled water.
- At 30 minutes: 5 mL of concentrated albumin solution is added outside the dialysis bag (to the beaker).
- Dialysis membrane: Permeable to small solutes and water, not permeable to large proteins like albumin.
Key Concept – Osmosis:
- Before albumin is added: Both the dialysis bag and the beaker contain distilled water → no net water movement, so the bag’s mass stays constant.
- After albumin is added: The beaker becomes hypertonic relative to the inside of the dialysis bag because albumin cannot pass through the membrane → Water moves out of the dialysis bag into the beaker by osmosis (from low solute to high solute concentration), reducing the mass of the bag.
Why Graph B Is Correct:
- Shows a flat line before 30 minutes → no mass change before albumin is added.
- After albumin is added, the graph shows a steady decrease in mass → consistent with water leaving the dialysis bag due to the new hypertonic environment outside.
Why the Others Are Incorrect:
A: No change at all — contradicts expected osmosis.
C: Shows initial gain, then loss — no mechanism for initial gain after albumin is added.
D: Shows gain after albumin is added — opposite of what would occur.