Home / IB DP Biology- C1.1 Enzymes and metabolism IB Style Questions For HL Paper 1

IB DP Biology- C1.1 Enzymes and metabolism IB Style Questions For HL Paper 1-New Syllabus

Question

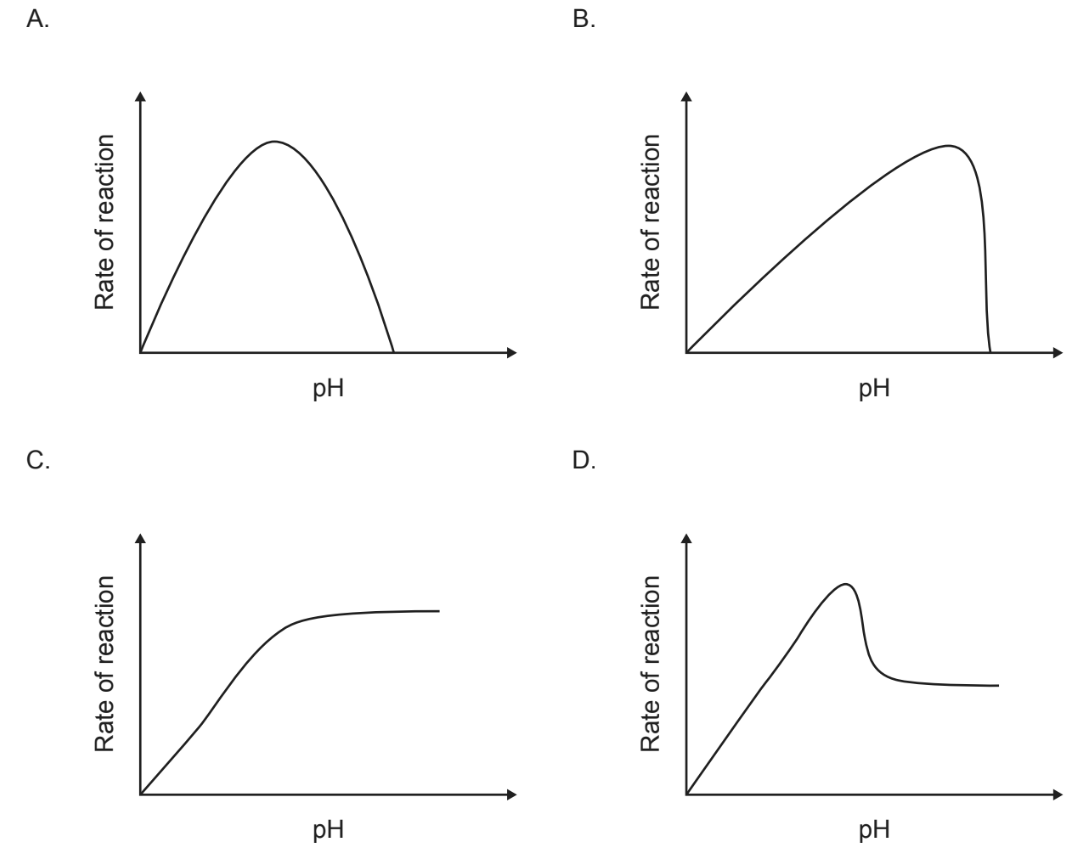
Which graph shows the effect of pH on the rate of most enzyme-catalysed reactions?

▶️ Answer/Explanation

Correct Answer: \( \boxed{\mathbf{A}} \)

Most enzymes have an optimum pH at which they work most efficiently. As the pH moves away from this optimum, the enzyme’s activity decreases because the active site changes shape. This produces a bell-shaped curve like Graph A, where the reaction rate rises to a maximum and then falls.

Question

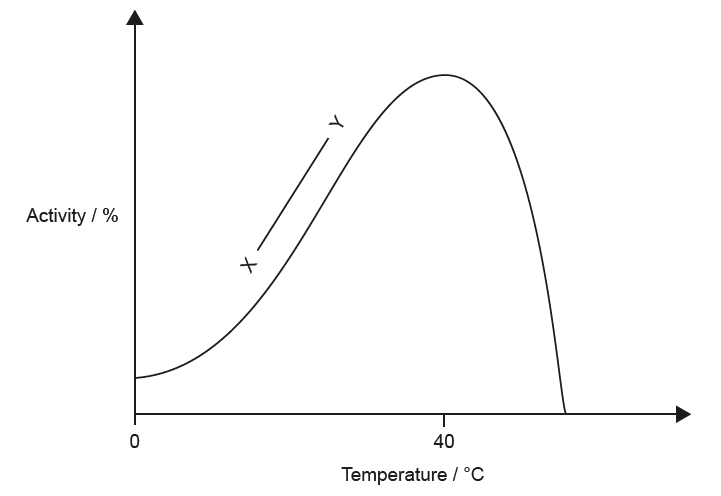
The graph shows the activity of an enzyme as temperature increases.

What explains the change in enzyme activity between X and Y?

(A) The enzyme is denaturing as the active site changes shape.
(B) Increased collisions occur as molecules are moving faster.
(C) Increased product concentration speeds up the reaction.
(D) An inhibitor has been added, reducing the number of active sites.

▶️ Answer/Explanation
Between X and Y, enzyme activity increases because temperature rise causes molecules to move faster, resulting in more frequent and energetic collisions between enzyme and substrate molecules. This increases the rate of successful enzyme-substrate interactions.
Answer: (B)

Question

What is an example of an intracellular enzyme-catalysed reaction?

(A) Chemical digestion in the gut
(B) Glycolysis in cellular respiration
(C) Blood clotting in the circulatory system
(D) Recycling of acetylcholine in a synapse

▶️ Answer/Explanation
Intracellular enzymes function within the cell to catalyse metabolic reactions. Glycolysis occurs inside the cytoplasm of cells and involves multiple enzyme-catalysed reactions that break down glucose to release energy.
Answer: (B)
Scroll to Top