▶️ Answer/Explanation
Detailed solution
(a)
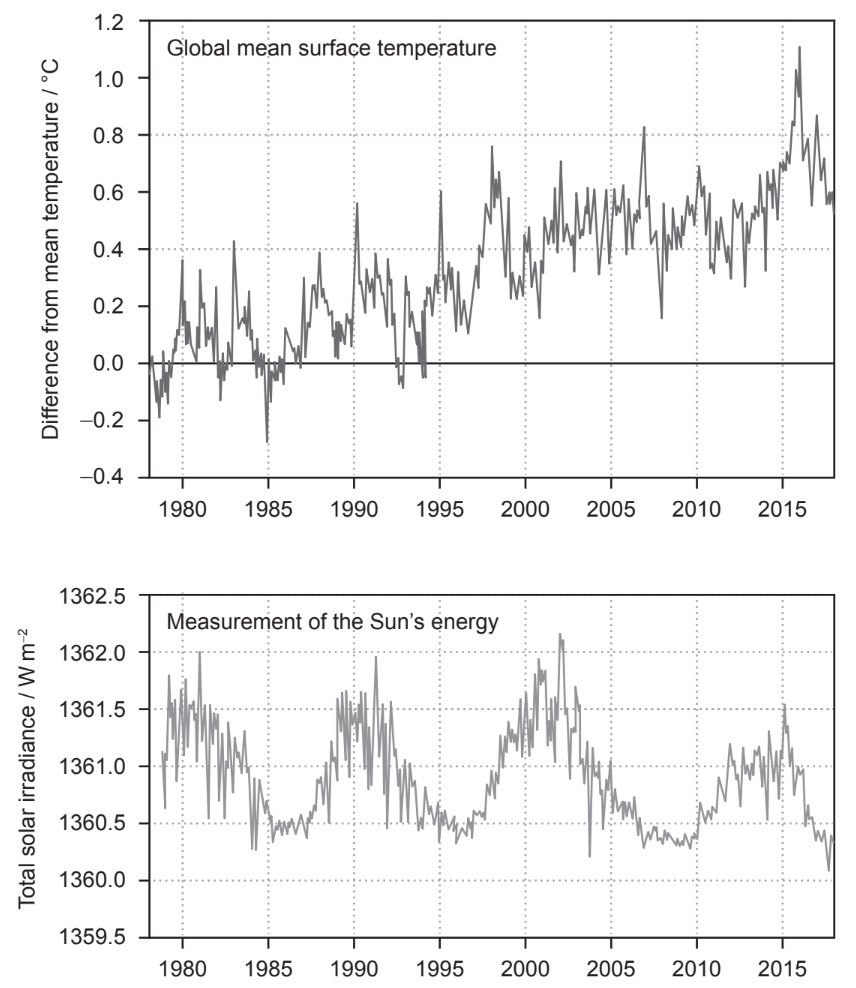
The evidence does not support the argument that solar variation is responsible for global temperature changes:
- Global surface temperature has shown a clear overall increase, while solar irradiance has remained relatively constant or even slightly decreased.
- The fluctuations in solar radiation do not match the patterns in temperature change, showing no strong correlation between the two datasets.
(b)
- Carbon dioxide absorbs infrared radiation emitted by Earth’s surface.
- This prevents some of the heat from escaping into space, causing heat to accumulate in the atmosphere.
- Incoming short-wave solar radiation still reaches Earth, but the increased trapping of long-wave radiation strengthens the greenhouse effect and raises global temperatures.
(c)
One example is methane. (Other acceptable answers: water vapour, nitrous oxide, ozone, CFCs, or halogenated gases.)