Topic 10.2: Inheritance
This unit will last 3 school days
Essential idea:
- Genes may be linked or unlinked and are inherited accordingly.
Nature of science:
- Looking for patterns, trends and discrepancies—Mendel used observations of the natural world to find and explain patterns and trends. Since then, scientists have looked for discrepancies and asked questions based on further observations to show exceptions to the rules. For example, Morgan discovered non-Mendelian ratios in his experiments with Drosophila. (3.1)
- Describe the trends and discrepancies that led Morgan to propose the idea of linked genes.
10.2 U 1 Gene loci are said to be linked if on the same chromosome. (Oxford Biology Course Companion page 448).
- Define autosome and sex chromosome.
- Describe what makes genes “linked.”
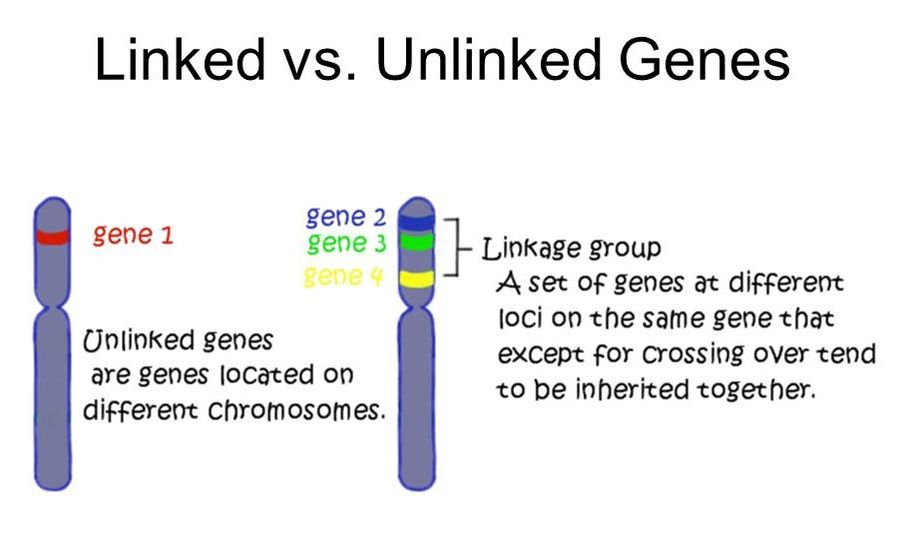
10.2 U 2 Unlinked genes segregate independently as a result of meiosis. (Oxford Biology Course Companion page 445).
- State the difference between independent assortment of genes and segregation of alleles.
- Describe segregation of alleles and independent assortment of unlinked genes in meiosis.
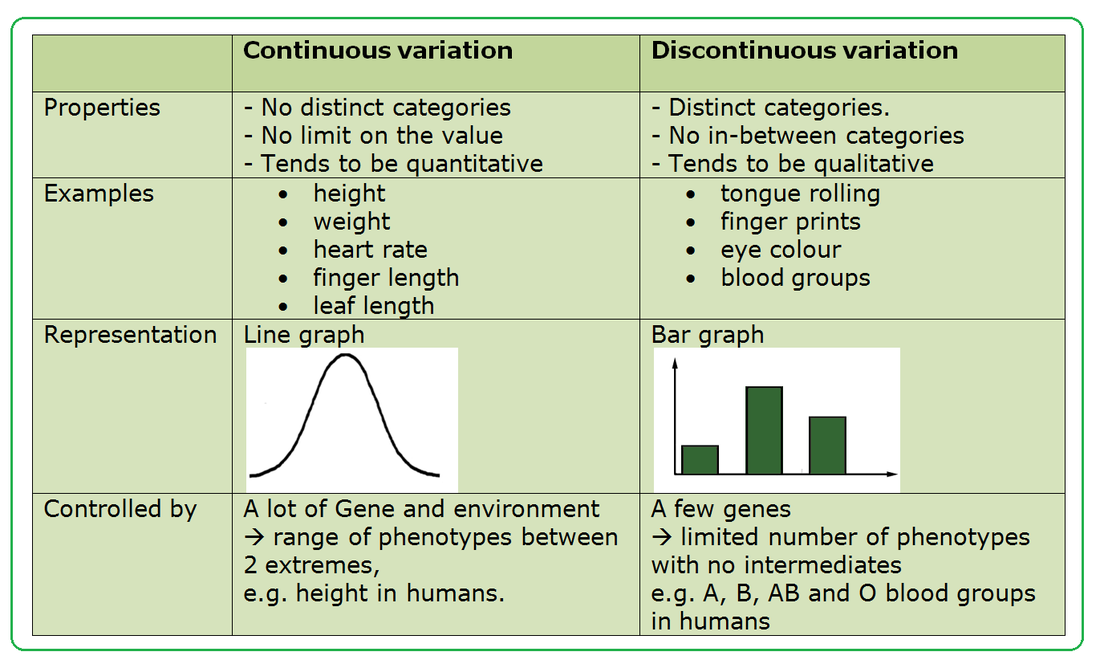
Discontinuous variation This is where individuals fall into a number of distinct classes or categories, and is based on features that cannot be measured across a complete range. You either have the characteristic or you don’t. Blood groups are a good example: you are either one blood group or another – you can’t be in between, same goes for gender. Such data is called discrete (or categorical) data. Chi-squared statistical calculations work well in this case.
In continuous variation there is a complete range of measurements from one extreme to the other. Height is an example of continuous variation – individuals can have a complete range of heights, for example, 1.6, 1.61, 1.62, 1.625 etc metres high.
10.2 U 4 The phenotypes of polygenic characteristics tend to show continuous variation (Oxford Biology Course Companion page 450).
- Explain polygenetic inheritance using an example of a two gene cross with codominant alleles.
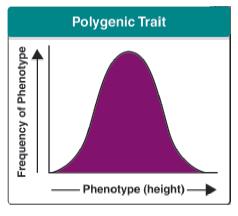
- State that a normal distribution of variation is often the result of polygenic inheritance.
- State example human characteristics that are associated with polygenic inheritance.
Continuous variation is the combined effect of many genes (known as polygenic inheritance) and is often significantly affected by environmental influences. Milk yield in cows, for example, is determined not only by their genetic make-up but is also significantly affected by environmental factors such as pasture quality and diet, weather, and the comfort of their surroundings.
Polygenic traits are controlled by two or more than two genes (usually by many different genes) at different loci on different chromosomes. These genes are described as polygenes. Examples of human polygenic inheritance are height, skin colour and weight. Polygenes allow a wide range of physical traits. For instance, height is regulated by several genes so that there will be a wide range of heights in a population.
10.2 U 5 Chi-squared tests are used to determine whether the difference between an observed and expected frequency distribution is statistically significant (Oxford Biology Course Companion page 453)
- State the two possible hypotheses of a statistical test.
- Calculate the chi square value to determine the significance of differences between the observed and expected results of a genetic cross.
- Determine the degrees of freedom and critical value for the chi-square test.
- Draw a conclusion of significance by comparing the calculated and critical chi-square values.
A chi-square test is a statistical test that can be used to determine whether observed frequencies are significantly different from expected frequencies. These statistical tests enable us to compare observed and expected frequencies empirically and to decide if the results we see are statistically significant. Statistical significance in this case implies that the differences are not due to chance alone, but instead may be caused by other factors at work.
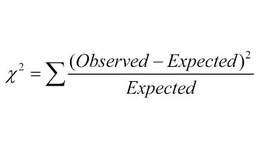
What it basically means is the sum of the (observed minus the expected) squared, divided by the expected. This value is then compared to a critical value from a chi-squared table (similar to a t-table) to determine if the numbers we see are due to random factors. This is useful in determining if the results from a dihybrid genetic cross are due to independent assortment.
- Degree of freedom – the number of independent values or quantities that can be assigned to a statistical distribution.
- To find the degree of freedom = n – 1, where n is the number of data points
- A critical value is the number you compare your own result to (critical values would be provided in a test).
- A confidence interval does not quantify variability. A 95% confidence interval is a range of values that you can be 95% certain contains the true mean of the population.
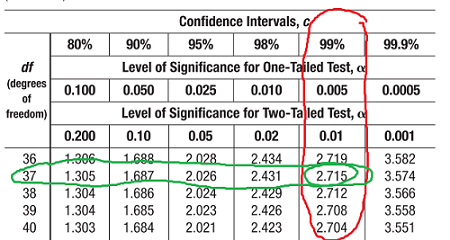
(Ignore the circled row and column)
If your OWN value for something is greater than the critical value, you REJECT the null hypothesis and ACCEPT the experimental hypothesis.
If you OWN value for something is less than the critical value, you ACCEPT the null hypothesis and REJECT the experimental hypothesis.
10. 2 A 1 Morgan’s discovery of non-Mendelian ratios in Drosophila. (Oxford Biology Course Companion page 446).
- Determine possible allele combinations in gametes for crosses involving two genes.
- Use correct notation to depict a dihybrid cross between two unlinked genes.
- Construct a Punnett square to show the possible genotype and phenotype outcomes in a dihybrid cross.
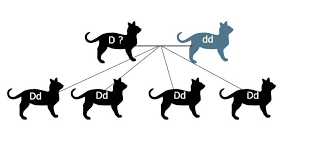
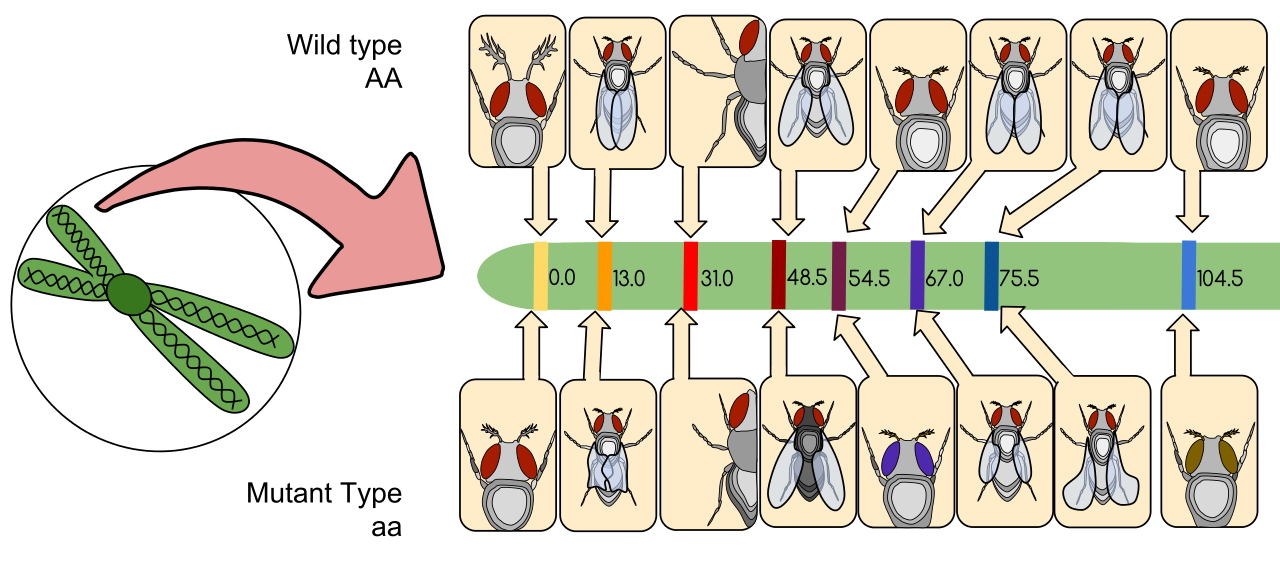
- Male fly with white eyes (flies usually have red eyes) was crossed with a female fly with red eyes (a wild type)
- The offspring of the first generation were red eyed
- Males and females of the first generation were crossed with each other
- The white-eye trait reappeared in the expected 3:1 Mendelian ratio for a recessive trait. However only the males had white eyes
- This suggested that the white-eye trait is carried on the X chromosome
- Crossing white-eyed males and red-eyed females from the second generation produced equal numbers of offspring with each eye colour
- Males have white eyes when they inherit the mutant gene on the X chromosome from their mother. Females only show the trait if they inherit mutant genes on both X chromosomes. This became known as “sex linkage
10.2 A 2 Completion and analysis of Punnett squares for dihybrid traits. (Oxford Biology Course Companion page 448).
- Describe how Morgan discovered relationship between eye color and sex in Drosophila.
Linked genes that have undergone recombination can be distinguished from unlinked genes via a test cross because the frequency of the recombinant genotypes will always be less than would occur for unlinked genes (crossing over does not happen every time)
For example:
- Heterozygous test cross of unlinked genes = 1 : 1 : 1 : 1 phenotypic ratio
- Heterozygous test cross of linked genes = 1 : 1 : 0.1 : 01 phenotypic ratio (uncommon phenotypes are recombinants)
- A dihybrid cross is a cross between two individuals that shows the inheritance of two different genes at the same time; usually involving unlinked autosomal genes.
- Note: The following example contains two unlinked genes, which means the genes are on different chromosomes. This means they follow Mendel’s law of independent assortment.
Dihybrid Cross Example
- Since almost all examples look at Mendel’s pea plants, for this example we will look at two traits in cats; hair length and color.
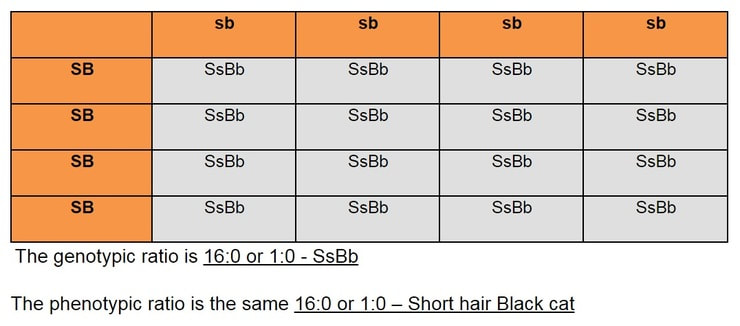
- If the question stated that short hair (S) is dominant over long hair (s) and black fur (B) is dominant over white fur (b), what would be the genotypic and phenotypic ratio of a cross between a short hair black cat that is homologous for these traits and a long hair white cat?
First, write out the cross: SSBB x ssbb
Next, write out the possible gametes: SB, SB, sb and sb or simply just SB and sb
10.2 A 3 Polygenic traits such as human height may also be influenced by environmental factors.(Oxford Biology Course Companion page 450).
- Outline two example environmental factors that can influence phenotypes.
- Compare continuous to discrete variation.
When one gene controls the expression of a trait, the number of phenotypes that are expressed is limited to the dominant phenotype or recessive phenotype. If there is co-dominance, this adds another possible phenotype that can be expressed.
With polygenic inheritance when two or more genes control the expression of a phenotype many possible phenotypes can exist. As the amount of genes that control one trait increase, the number of phenotypes increases to a point where it is impossible to determine the genotype by just observing the phenotype. Each additional gene has an additive affect, increasing the phenotypes. This is called continuous variation.
For example, people’s skin color varies dramatically around the world, between people of different races and within the same race. The multiple genes affect the intensity of the pigments in the skin. Another example is human height, which varies from person to person within the same race, and varies between different races. Height shows continuous variation.
If you graphed the frequency of the occurrence of different phenotypic variations in a population, there should be a normal distribution. Continuing with human height, there will be some really tall people and some really short people, but the majority of people will be average height (normal distribution). As the number of genes that control a certain trait increases, the closer the distribution of the phenotypes represents a normal distribution.
10.2 S 1 Calculation of the predicted genotypic and phenotypic ratio of offspring\ of dihybrid crosses involving unlinked autosomal genes. (Oxford Biology Course Companion page 447).
- Determine the predicted genotype and phenotype ratios of F1 and F2 offspring of dihybrid crosses.
10.2 S 2 Identification of recombinants in crosses involving two linked genes. (Oxford Biology Course Companion page 451).
- Use correct notation to show alleles of linked genes.
- Construct a Punnett square to show the possible genotype and phenotype outcomes in a dihybrid cross involving linked genes.
- Explain how crossing over between linked genes can lead to genetic recombinants.
In a cross between two true breeding or homozygous parents the following would be the genotypes of the cross: TTBB x ttbb.
On an exam if the genes are linked the genotypes would be represented as follows:
Explanation of Recombinants
The genotypes represented on the right show that T and B are on the same chromosome with one pair on the maternal chromosome and one pair on the paternal chromosome
- The horizontal line represents the homologous chromosomes
- The same can be said about the alleles t and b
- The resulting cross should show that all the offspring are heterozygous for the traits
- As the genes are linked T and B will go into the same gamete as will t and b, resulting in the heterozygous TtB
- If we now crossed the two heterozygous offspring TtBb the cross would be represented by the symbols on the right
- Since the genes are linked T and B and t and b chromatids should be inherited together
- The resulting gametes would contain TB and tb alleles, therefore the majority of the offspring will be TTBB, TtBb and ttbb
- This does not follow Mendel’s law off independent assortment because the genes are on the same chromosomes
- However, crossing over can occur between the non-sister chromatids during prophase I of meiosis resulting in offspring with different genotypes
- The gametes Tb and tB could also occur with crossing over, resulting in the recombinant offspring TtBB and TTBb
- Recombinants have different alleles combinations than either of the parents
The recombinants would be represented by the symbols on the right
TB, Tb, and tB would now be the new linked alleles for the next generation
10.2 S 3 Use of a chi-squared test on data from dihybrid crosses. (Oxford Biology Course Companion page 453).
- Calculate a chi-square value to compare observed and expected results of a dihybrid genetic cross.
- Using the df and critical chi-square value, determine if there is a significant difference between observed and expected results of a dihybrid cross.
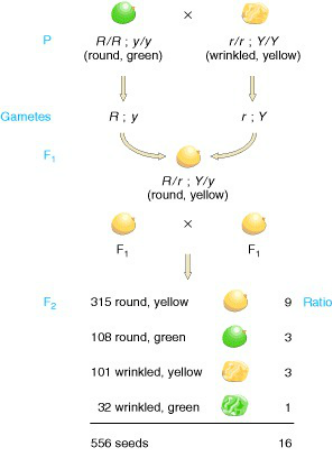
For an example, use Mendel’s results from his pea plant crosses.
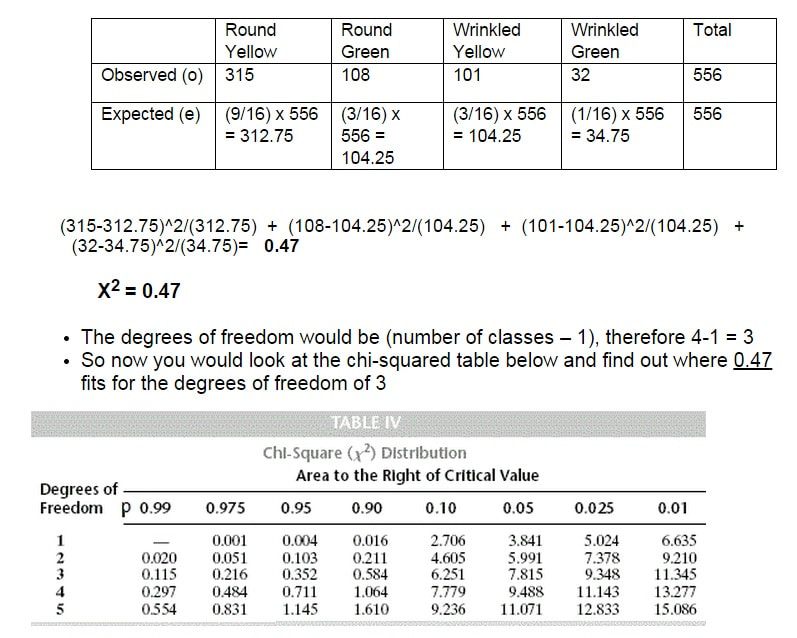
When he did a dihybrid cross between two heterozygotes RrYy x RrYy, the expected phenotypic ratio due to independent assortment would be 9:3:3:1. Look at the chart below to see his actual results.
What the p-value of 0.05 or 5% indicates is the probability of getting the results you did (or more extreme results) given that the null hypothesis is true.
If the calculated value is above or equal to 7.815 then we reject the Ho and accept the HA that the alleles in question are linked. However, since our chi-squared value of 0.47 is significantly less than this value (it has a p-value of 0.90 or 90%) we accept the Ho that the results that Mendel saw were due to independently assortment of the alleles.
NOTE: Alleles are usually shown side by side in dihybrid crosses, for example, TtBb. In representing crosses involving linkage, it is more common to show them as vertical pairs, for example: