IBDP Geography-Part two -Population distribution- changing population: IB style Questions HLSL Paper 2

Question

When relevant, answers should refer to case studies or examples, and where appropriate include well-drawn maps or diagrams.
1. Changing population
The diagram shows the population pyramid for Japan in 2018.

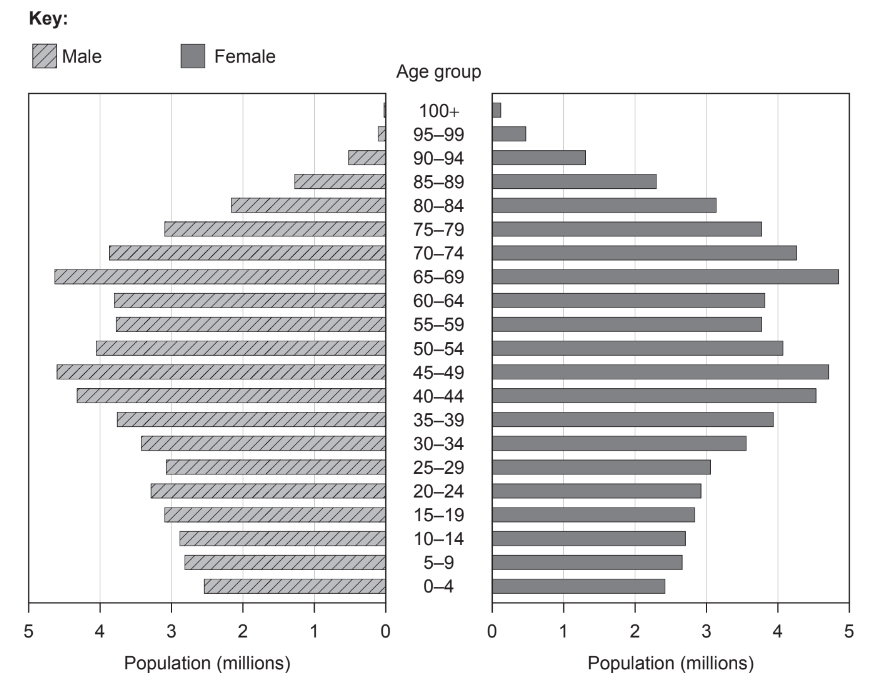
(a) (i) Identify the age group with the highest number of people. [1]

(ii) Estimate the total population, in millions, aged 0–14. [1]

(b) Explain two ways of managing the economic problems associated with an ageing society. [2 + 2]

Way 1: . . . . . . . . . . . . . . . . . . . . . . . . . . . . . . . . . . . . . . . . . . . . . . . . . . . . . . . . . . . . . . . . . . .

Way 2: . . . . . . . . . . . . . . . . . . . . . . . . . . . . . . . . . . . . . . . . . . . . . . . . . . . . . . . . . . . . . . . . . . .

(c) Explain how two physical factors can lead to uneven population distribution in one place you have studied. [2 + 2]
Physical factor 1: . . . . . . . . . . . . . . . . . . . . . . . . . . . . . . . . . . . . . . . . . . . . . . . . . . . . . . . . . .

Physical factor 2: . . . . . . . . . . . . . . .. . . . . . . . . . . . . . . . . . . . . . . . . . . . . . . . . . . . . . . . . . . . . . . . . . . . . . . . . . . . . . . . . . . . . . . . . .

▶️Answer/Explanation

Ans:

(i)65-69

(ii)16 (million) Accept 14-18.

Award [1] for identifying a valid way and [1] for further development/exemplification that explains how it addresses the economic problem.
For example: Raising pension age [1] so individuals are paid pensions for a shorter period of time [1].
Other management strategies include:
• Encouraging immigration to increase workforce/maintain tax revenues.
• Increasing taxation to pay for pensions.
• Increased use of technology e.g. in care homes
• Changing pension system e.g. introduction of private pensions to decrease the burden
on the state, phased retirement to encourage older workers to stay in employment
• Encourage volunteer care work to reduce expenditure on the elderly.
• Improve health of elderly to reduce money spent on hospitals.
• Improve workplace attitudes to the elderly/workplace design – encourages elderly to stay
in employment and require less money spent on them/keep contributing.
• Support lifelong learning – boosts employability of ageing society/keeps minds active.
• Pro-natal policies – increases working age group to increase tax revenue.

The geography guide refers to population distribution at a national scale so expect many candidates to refer to this scale but accept other valid scales that illustrate one place – e.g. regional

Award [1] for a physical factor and [1] for further development/exemplification that explains how the factor leads to uneven distribution.

Candidates may refer to uneven via concentration or sparsity. Physical factors must refer to one place for full marks. Only credit factors that relate to the same place for both physical factors. If no identified place award [1] for valid factor plus development up to a maximum of [2].

For example: Population will be concentrated in areas close to rivers in New South Wales [1] where there is abundant water supplies for agriculture/domestic consumption [1].

Other possible physical factors include:

  • Climate – population sparse in areas of arid climate in Australia/lack of water supply
  •  Relief – population concentrated in lowland areas such as North China Plain/easier to farm.
  • Altitude – population sparse at high altitude in Chile/difficult to breath
  • Proximity to bays/estuaries/coast – high population densities along Norwegian coast/access to fishing and transport
  •  Fertile soils – higher concentrations in the Nile valley in Egypt/allow agriculture.
  • Distance – isolated areas in northern Canada/away from areas of economic development
  •  Resources e.g. coal/mineral deposits – high concentrations in South Wales valleys/coal mining attracted people for jobs
  •  Floodplains of the Severn Valley that suffer from frequent natural disasters [e.g. flooding] have lower density/as housing is in danger
  •  Areas that suffer from disease induced by physical factors [e.g. coastal areas of Papua New Guinea] have lower densities/people suffer from malaria
  • Landlocked areas have lower population/difficulty of trade.
  • Dense vegetation in the Amazon Basin area of Brazil has sparse population/provide issues of accessibility.

Question

To what extent do migrations bring benefits to both their origins and their destinations?

▶️Answer/Explanation

Markscheme

Responses should consider the benefits at both the point of origin and the final destinations and the strongest responses may refer to both voluntary/economic and involuntary/forced migrations. At the origin, benefits include: income derived from remittances and the alleviation of poverty; the reduction in population pressure and demand for resources.

Benefits for the receiving region or society include an increased availability of workers, often willing to work for lower wages, or in unpopular jobs, and with less stringent working conditions. Cultural mixing may also be seen as either a benefit or a disadvantage, depending on the example(s) discussed. Forced migrations generally benefit only the migrants themselves, through the better provision of food and shelter, and increased security.

It is possible for responses to include the costs of migration as the question is “to what extent”.

Responses must make use of examples and have an evaluation to reach markbands E and F.

While many responses are likely to conclude that the benefits at the destination outweigh the benefits at the point of origin, all conclusions/evaluations should be judged strictly on the merits of the arguments presented and of any example(s) chosen.

Marks should be allocated according to the markbands.

Question

Examine the view that rapid population growth will prevent some countries from meeting their Millennium Development Goals.

▶️Answer/Explanation

Markscheme

Responses would be expected to show a clear understanding of the MDGs.

Responses may show that increased population numbers could be an obstacle to health, welfare and education provision, especially where there is poor governance of resources. However, there are other issues to consider, such as growing wealth inequalities, innovation resulting from population growth, corruption, civil war.

It is expected that there should be some discussion here about the link between population growth and poverty. Reducing population is not an MDG; rather it is an expected outcome that will become evident as countries reach their MDGs.

The strongest answers may conclude that some MDGs are easier to reach than others or that rapid population growth in some countries may have the opposite effect.

Responses presenting accurate, specific and well-detailed knowledge and understanding of MDGs with relevant examples and evaluation of the links with rapid population growth will reach level E or F.

Marks should be allocated according to the markbands.

Question

Examine the view that gender inequalities are a major obstacle to development.

▶️Answer/Explanation

Markscheme

There are many possible approaches to this question.

Responses could explain what development is and successfully link the concept to increased gender equality.

Responses are likely to identify and discuss the relative importance of all the MDGs that in some way relate to gender empowerment (goals 1, 3, and 5 especially).

The answer should examine either how not addressing gender issues will hinder development or explain how addressing them will help nations and communities develop. Allow for broad interpretations of development. Candidates could also identify other factors (other than gender inequality) which are also obstacles to development – this would be a valid approach as long as gender inequality is examined and their reasoning is justified.

Responses that arrive at a clear conclusion either agreeing or disagreeing with the viewpoint, after a sound discussion, are likely to be awarded band E or above.

Marks should be allocated according to the markbands.

Question

The graphs show how two countries score in the World Economic Forum’s Gender Gap Index 2012, and how each compares to the world average.

The index looks at four aspects of inequality and each ranges from 0.00 (extreme inequality) to 1.00 (total equality).

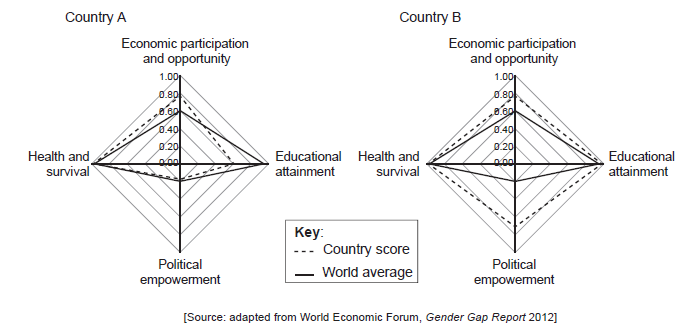
(i) Identify which country has greater gender equality.

(ii) Using data from the graph, describe how gender equality in country A differs from the world average.[4]

a.

Suggest two possible reasons why women in countries like country B have a high level of political empowerment.[4]

b.

Explain two reasons why the life expectancy in many low-income and middle-income countries is increasing[4]

c.
▶️Answer/Explanation

Markscheme

(i) Country B

(ii) For full marks, responses must comment on at least three of the four indicators and make some reference to data.

Possible statements:

  • economic participation and opportunity – country A (0.80) is scoring better than the world average (0.60)
  • political empowerment and health and survival – country A is almost the same as the world average at (0.2) and (1.00) respectively
  • educational attainment – country A (0.60) falls well below the world average (0.90).
a.

In each case, award [1] for a valid reason, and [1] for further explanation, exemplification and/or detail.

For example: Country B could have a quota system [1] that guarantees a minimum percentage/number of positions in government for women [1].

Other possibilities could include:

  • affirmative action policies
  • women’s rights advocacy groups
  • state encouragement of female education up to tertiary levels
  • large percentage of women in the civil service
  • a female head of state could encourage more female involvement
  • an education system that boosts confidence in girls and women.

Do not accept responses that country B is more developed – this is unfortunately not accurate and also too vague an answer.

b.

In each case, award [1] for a valid reason, and [1] for further explanation, exemplification and/or detail.

For example: Improved water quality [1] reduced cases of water-borne diseases [1].

or

Access to antiretroviral therapies [1] increased life expectancy in many Sub-Saharan nations [1].

Other possibilities could include:

  • better access to healthcare
  • improved reliability of water supplies
  • the work of civil societies and MGOs such as MSF/WHO
  • improved food security and access.
c.

Question

“Population growth is the greatest threat to our planet’s soil quality and biodiversity.” Discuss this statement.

▶️Answer/Explanation

Markscheme

Refer to Paper 1 Section B markbands (available under the “Resources” tab) when marking this question.

Candidates can agree or disagree with the statement but need to be able to support their position. It is also possible that responses may agree partially with the statement. Either of these approaches is acceptable.

Population growth should be addressed in terms of the regional variations with some regions predicted to grow quite rapidly (Sub Saharan Africa) and others being predicted to experience negative growth (Japan, Europe).

Causes of soil degradation and loss of biodiversity of tropical rainforest (allow other biomes/ecosystems) should be addressed to assess the extent to which population growth is a contributing factor.

Candidates may also look at alternative threats to our planet’s soil quality and biodiversity, such as climate change, how an increasing standard of living results in increased consumption irrespective of population growth, the concentration of population in urban areas and the expansion of cities, changing agricultural practices, pollution, invasive species, poaching etc.

Responses should make use of examples but responses that focus on describing soil quality and biodiversity and not focusing on the role of population growth will be self-limiting.

It is not necessary for the discussion of soil quality and biodiversity to be of equal depth for the award of full marks.

At band D, expect some description of the issues of population growth, soil quality and biodiversity.

At band E, expect either some explanation of a range of threats that population growth poses to soil quality and biodiversity or a discussion of why other factors besides population growth may be equally or more important in terms of their impacts on soil quality and biodiversity.

At band F, expect both.

Marks should be allocated according to Paper 1 Section B markbands

Question

To what extent do migrations bring benefits to both their origins and their destinations?

▶️Answer/Explanation

Markscheme

Responses should consider the benefits at both the point of origin and the final destinations and the strongest responses may refer to both voluntary/economic and involuntary/forced migrations. At the origin, benefits include: income derived from remittances and the alleviation of poverty; the reduction in population pressure and demand for resources.

Benefits for the receiving region or society include an increased availability of workers, often willing to work for lower wages, or in unpopular jobs, and with less stringent working conditions. Cultural mixing may also be seen as either a benefit or a disadvantage, depending on the example(s) discussed. Forced migrations generally benefit only the migrants themselves, through the better provision of food and shelter, and increased security.

It is possible for responses to include the costs of migration as the question is “to what extent”.

Responses must make use of examples and have an evaluation to reach markbands E and F.

While many responses are likely to conclude that the benefits at the destination outweigh the benefits at the point of origin, all conclusions/evaluations should be judged strictly on the merits of the arguments presented and of any example(s) chosen.

Marks should be allocated according to the markbands.

Scroll to Top