Question 1 [Maximum mark: 18]
As part of his mathematics exploration about classic books, Jason investigated the time taken by students in his school to read the book The Old Man and the Sea. He collected his data by
stopping and asking students in the school corridor, until he reached his target of 10 students from each of the literature classes in his school.
State which of the two sampling methods, systematic or quota, Jason has used. [1]
Jason constructed the following box and whisker diagram to show the number of hours students in the sample took to read this book.
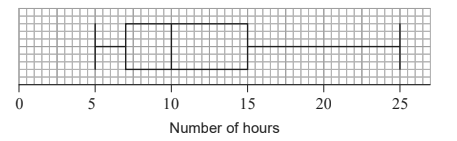
Write down the median time to read the book. [1]
Calculate the interquartile range. [2]
Mackenzie, a member of the sample, took 25 hours to read the novel. Jason believes Mackenzie’s time is not an outlier.
Determine whether Jason is correct. Support your reasoning. [4] For each student interviewed, Jason recorded the time taken to read The Old Man and the
Sea ( x ), measured in hours, and paired this with their percentage score on the final exam ( y ).
These data are represented on the scatter diagram.
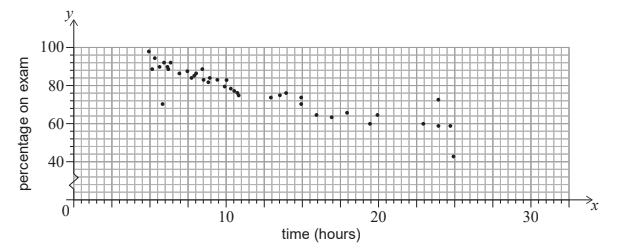
Describe the correlation. [1]
Jason correctly calculates the equation of the regression line y on x for these students to be
y = -1.54x + 98.8 .
He uses the equation to estimate the percentage score on the final exam for a student who read the book in 1.5 hours.
Find the percentage score calculated by Jason. [2]
State whether it is valid to use the regression line y on x for Jason’s estimate. Give a reason for your answer. [2]
Jason found a website that rated the ‘top 50’ classic books. He randomly chose eight of these classic books and recorded the number of pages. For example, Book H is rated 44th and has 281 pages. These data are shown in the table.
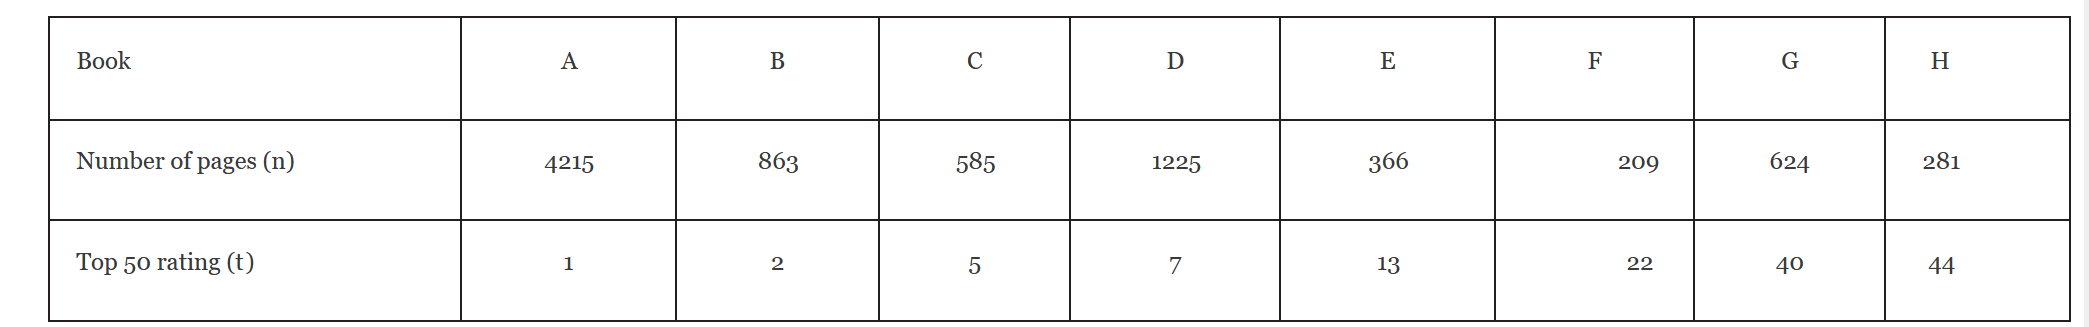
Jason intends to analyse the data using Spearman’s rank correlation coefficient, rs .
Copy and complete the information in the following table. [2]
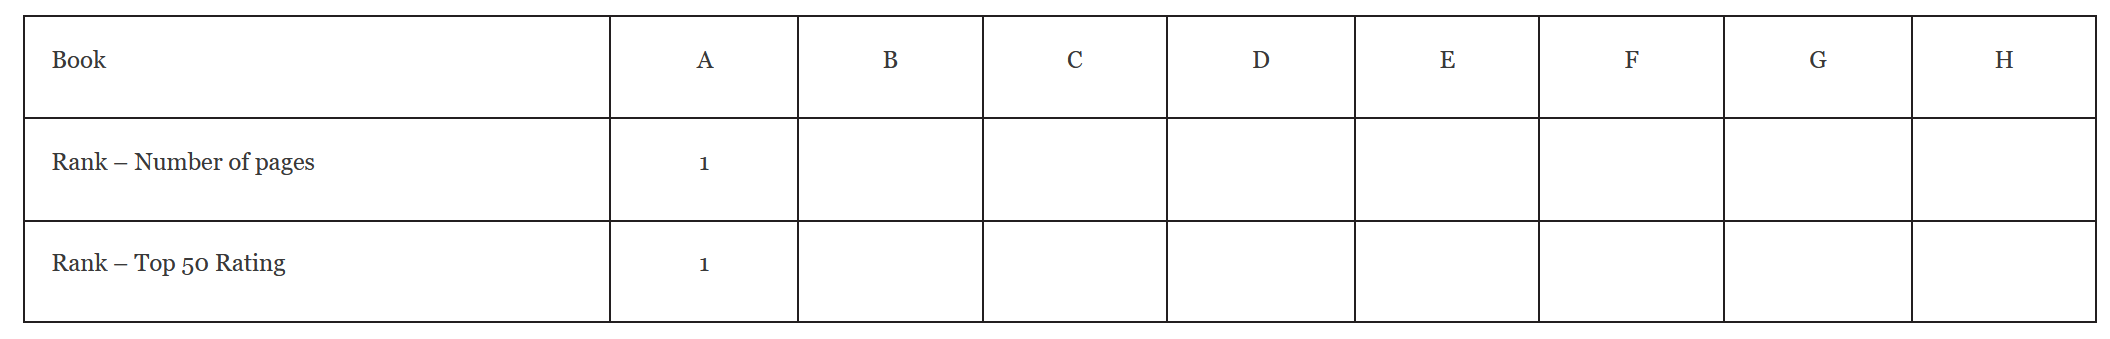
(i) Calculate the value of rs .
(ii) Interpret your result. [3]
Answer/Explanation
(a) Quota sampling
(b) 10(hours) (c) 15 – 7 = 8
(d) indication of a valid attempt to find the upper fence 15 + 1.5 × 8 = 27 25 27 < (accept equivalent answer in words) Jason is correct
(e) “negative” seen (f) correct substitution y =− 1.54 × 1.5 + 98.8 96.5 (%) (96.49)
(g) not reliable extrapolation OR outside the given range of the data
(h) 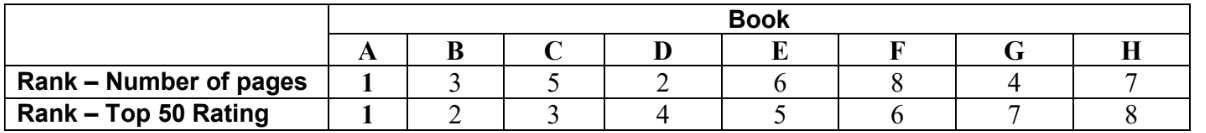
(i) (i) 0.714 (0.714285…)
(ii) EITHER
there is a (strong/moderate) positive association between the number of pages an the top 50 rating. OR there is a (strong/moderate) agreement between the rank order of number of pages and the rank order top 50 rating. OR there is a (strong/moderate) positive (linear) correlation between the rank order of number of pages and the rank order top 50 rating.
Question
The scores of the eight highest scoring countries in the 2019 Eurovision song contest are
shown in the following table.
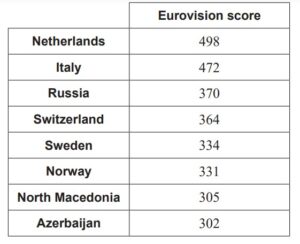
(a) For this data, find
(i) the upper quartile.
(ii) the interquartile range. [4]
(b) Determine if the Netherlands’ score is an outlier for this data. Justify your answer. [3]
(Question 3 continued)
Chester is investigating the relationship between the highest-scoring countries’ Eurovision
score and their population size to determine whether population size can reasonably be
used to predict a country’s score.
The populations of the countries, to the nearest million, are shown in the table.
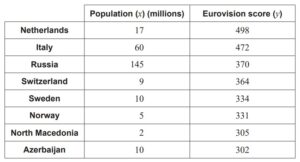
Chester finds that, for this data, the Pearson’s product moment correlation coefficient
is r = 0.249.
(c) State whether it would be appropriate for Chester to use the equation of a regression
line for y on x to predict a country’s Eurovision score. Justify your answer. [2]
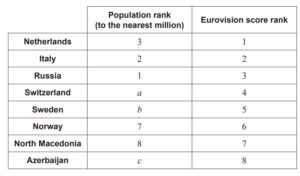
Chester then decides to find the Spearman’s rank correlation coefficient for this data,
and creates a table of ranks.
(Question 3 continued)
(d) Write down the value of:
(i) a ,
(ii) b ,
(iii) c . [3]
(e) (i) Find the value of the Spearman’s rank correlation coefficient rs .
(ii) Interpret the value obtained for rs . [3]
(f) When calculating the ranks, Chester incorrectly read the Netherlands’ score as 478.
Explain why the value of the Spearman’s rank correlation rs does not change despite
this error. [1]
Answer/Explanation
Ans
3. (a) (i) \(\frac{370+472}{2}\) (M1)
Note: This (M1) can also be awarded for either a correct Q3 or a correct Q1
in part (a)(ii).
Q3 = 421 A1
(ii) their part (a)(i) – their Q1 (clearly stated) (M1)
IQR = (421 – 318 = ) 103 A1
[4 marks]
(b) (Q3 + 1.5 (IQR) =) 421 + 1.5 × 10³) (M1)
= 575.5
since 498<575.5 R1
Netherlands is not an outlier A1
Note: The R1 is dependent on the (M1). Do not award R0A1 [3 marks]
(c) not appropriate (“no” is sufficient) A1
as r is too close to zero / too weak a correlation R1
[2 marks]
(d) (i) 6 A1
(ii) 4.5 A1
(iii) 4.5 A1
[3 marks]
(e) (i) rs = 0.683 (0.682646…) A2
(ii) EITHER
there is a (positive) association between the population size and
the score A1
OR
there is a (positive) linear correlation between the ranks of the population size
and the ranks of the scores (when compared with the PMCC of 0.249). A1
[3 marks]
(f) lowering the top score by 20 does not change its rank so rs is unchanged R1
Note: Accept “this would not alter the rank” or “Netherlands still top rank” or similar.
Condone any statement that clearly implies the ranks have not changed, for
example: “The Netherlands still has the highest score.”
[1 mark]
[Total 16 marks]
Question
When Geraldine travels to work she can travel either by car (C), bus (B) or train (T). She travels by car on one day in five. She uses the bus 50 % of the time. The probabilities of her being late (L) when travelling by car, bus or train are 0.05, 0.12 and 0.08 respectively.
It is not necessary to use graph paper for this question.
Copy the tree diagram below and fill in all the probabilities, where NL represents not late, to represent this information.
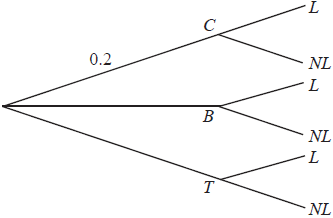 [5]
[5]
Find the probability that Geraldine travels by bus and is late.[1]
Find the probability that Geraldine is late.[3]
Find the probability that Geraldine travelled by train, given that she is late.[3]
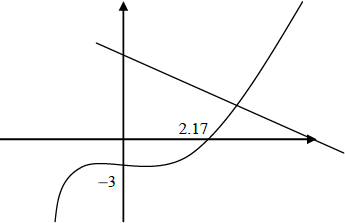
Sketch the curve of the function \(f (x) = x^3 − 2x^2 + x − 3\) for values of \(x\) from −2 to 4, giving the intercepts with both axes.[3]
On the same diagram, sketch the line \(y = 7 − 2x\) and find the coordinates of the point of intersection of the line with the curve.[3]
Find the value of the gradient of the curve where \(x = 1.7\) .[2]
Answer/Explanation
Markscheme
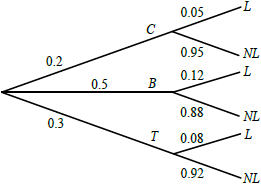
Award (A1) for 0.5 at B, (A1) for 0.3 at T, then (A1) for each correct pair. Accept fractions or percentages. (A5)[5 marks]
0.06 (accept \(0.5 \times 0.12\) or 6%) (A1)(ft)[1 mark]
for a relevant two-factor product, either \(C \times L\) or \(T \times L\) (M1)
for summing three two-factor products (M1)
\((0.2 \times 0.05 + 0.06 + 0.3 \times 0.08)\)
0.094 (A1)(ft)(G2)[3 marks]
\(\frac{{0.3 \times 0.08}}{{0.094}}\) (M1)(A1)(ft)
award (M1) for substituted conditional probability formula seen, (A1)(ft) for correct substitution
= 0.255 (A1)(ft)(G2)[3 marks]
 (G3)[3 marks]
line drawn with –ve gradient and +ve y-intercept (G1)
(2.45, 2.11) (G1)(G1)[3 marks]
\(f ‘ (1.7) = 3(1.7)^2 – 4(1.7) + 1\) (M1)
award (M1) for substituting in their \(f’ (x)\)
2.87 (A1)(G2)[2 marks]
Question
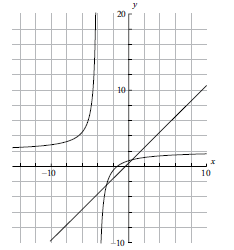
Consider the functions \(f(x) = \frac{{2x + 3}}{{x + 4}}\) and \(g(x) = x + 0.5\) .
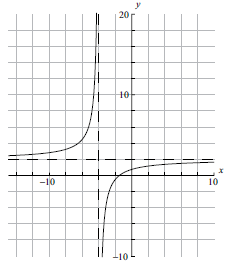
Sketch the graph of the function \(f(x)\), for \( – 10 \leqslant x \leqslant 10\) . Indicating clearly the axis intercepts and any asymptotes.[6]
Write down the equation of the vertical asymptote.[2]
On the same diagram as part (a) sketch the graph of \(g(x) = x + 0.5\) .[2]
Using your graphical display calculator write down the coordinates of one of the points of intersection on the graphs of \(f\) and \(g\), giving your answer correct to five decimal places.[3]
Write down the gradient of the line \(g(x) = x + 0.5\) .[1]
The line \(L\) passes through the point with coordinates \(( – 2{\text{, }} – 3)\) and is perpendicular to the line \(g(x)\) . Find the equation of \(L\).[3]
Answer/Explanation
Markscheme
 (A6)
(A6)
Notes: (A1) for labels and some idea of scale.
(A1) for \(x\)-intercept seen, (A1) for \(y\)-intercept seen in roughly the correct places (coordinates not required).
(A1) for vertical asymptote seen, (A1) for horizontal asymptote seen in roughly the correct places (equations of the lines not required).
(A1) for correct general shape.[6 marks]
\(x = – 4\) (A1)(A1)(ft)
Note: (A1) for \(x =\), (A1)(ft) for \( – 4\).[2 marks]
 (A1)(A1)
Note: (A1) for correct axis intercepts, (A1) for straight line[2 marks]
\(( – 2.85078{\text{, }} – 2.35078)\) OR \((0.35078{\text{, }}0.85078)\) (G1)(G1)(A1)(ft)
Notes: (A1) for \(x\)-coordinate, (A1) for \(y\)-coordinate, (A1)(ft) for correct accuracy. Brackets required. If brackets not used award (G1)(G0)(A1)(ft).
Accept \(x = – 2.85078\), \(y = – 2.35078\) or \(x = 0.35078\), \(y = 0.85078\).[3 marks]
\({\text{gradient}} = 1\) (A1)[1 mark]
\({\text{gradient of perpendicular}} = – 1\) (A1)(ft)
(can be implied in the next step)
\(y = mx + c\)
\( – 3 = – 1 \times – 2 + c\) (M1)
\(c = – 5\)
\(y = – x – 5\) (A1)(ft)(G2)
OR
\(y + 3 = – (x + 2)\) (M1)(A1)(ft)(G2)
Note: Award (G2) for correct answer with no working at all but (A1)(G1) if the gradient is mentioned as \( – 1\) then correct answer with no further working.[3 marks]
Question
Mal is shopping for a school trip. He buys \(50\) tins of beans and \(20\) packets of cereal. The total cost is \(260\) Australian dollars (\({\text{AUD}}\)).
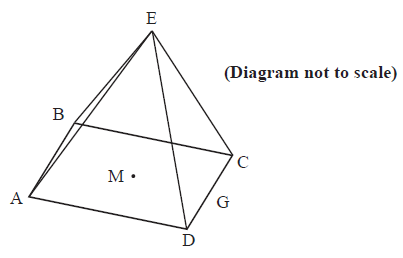
The triangular faces of a square based pyramid, \({\text{ABCDE}}\), are all inclined at \({70^ \circ }\) to the base. The edges of the base \({\text{ABCD}}\) are all \(10{\text{ cm}}\) and \({\text{M}}\) is the centre. \({\text{G}}\) is the mid-point of \({\text{CD}}\).
Write down an equation showing this information, taking \(b\) to be the cost of one tin of beans and \(c\) to be the cost of one packet of cereal in \({\text{AUD}}\).[1]
Stephen thinks that Mal has not bought enough so he buys \(12\) more tins of beans and \(6\) more packets of cereal. He pays \(66{\text{ AUD}}\).
Write down another equation to represent this information.[1]
Stephen thinks that Mal has not bought enough so he buys \(12\) more tins of beans and \(6\) more packets of cereal. He pays \(66{\text{ AUD}}\).
Find the cost of one tin of beans.[2]
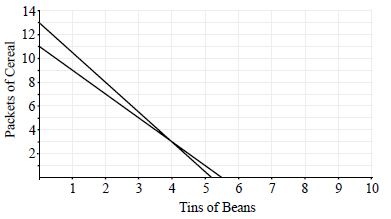
(i) Sketch the graphs of the two equations from parts (a) and (b).
(ii) Write down the coordinates of the point of intersection of the two graphs.[4]
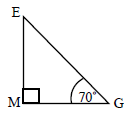
Using the letters on the diagram draw a triangle showing the position of a \({70^ \circ }\) angle.[1]
Show that the height of the pyramid is \(13.7{\text{ cm}}\), to 3 significant figures.[2]
Calculate
(i) the length of \({\text{EG}}\);
(ii) the size of angle \({\text{DEC}}\).[4]
Find the total surface area of the pyramid.[2]
Find the volume of the pyramid.[2]
Answer/Explanation
Markscheme
\(50b + 20c = 260\) (A1)[1 mark]
\(12b + 6c = 66\) (A1)[1 mark]
Solve to get \(b = 4\) (M1)(A1)(ft)(G2)
Note: (M1) for attempting to solve the equations simultaneously.[2 marks]
(i)
 (A1)(A1)(A1)
Notes: Award (A1) for labels and some idea of scale, (A1)(ft)(A1)(ft) for each line.
The axis can be reversed.
(ii) \((4,3)\) or \((3,4)\) (A1)(ft)
Note: Accept \(b = 4\), \(c = 3\)[4 marks]
 (A1)[1 mark]
\(\tan 70 = \frac{h}{5}\) (M1)
\(h = 5\tan 70 = 13.74\) (A1)
\(h = 13.7{\text{ cm}}\) (AG)[2 marks]
Unit penalty (UP) is applicable in this part of the question where indicated in the left hand column.
(i) \({\text{E}}{{\text{G}}^2} = {5^2} + {13.7^2}\) OR \({5^2} + {(5\tan 70)^2}\) (M1)
(UP) \({\text{EG}} = 14.6{\text{ cm}}\) (A1)(G2)
(ii) \({\text{DEC}} = 2 \times {\tan ^{ – 1}}\left( {\frac{5}{{14.6}}} \right)\) (M1)
\( = {37.8^ \circ }\) (A1)(ft)(G2)[4 marks]
Unit penalty (UP) is applicable in this part of the question where indicated in the left hand column.
\({\text{Area}} = 10 \times 10 + 4 \times 0.5 \times 10 \times 14.619\) (M1)
(UP) \( = 392{\text{ c}}{{\text{m}}^2}\) (A1)(ft)(G2)[2 marks]
Unit penalty (UP) is applicable in this part of the question where indicated in the left hand column.
\({\text{Volume}} = \frac{1}{3} \times 10 \times 10 \times 13.7\) (M1)
(UP) \( = 457{\text{ c}}{{\text{m}}^3}\) (\(458{\text{ c}}{{\text{m}}^3}\)) (A1)(G2)[2 marks]
Question
Mal is shopping for a school trip. He buys \(50\) tins of beans and \(20\) packets of cereal. The total cost is \(260\) Australian dollars (\({\text{AUD}}\)).
The triangular faces of a square based pyramid, \({\text{ABCDE}}\), are all inclined at \({70^ \circ }\) to the base. The edges of the base \({\text{ABCD}}\) are all \(10{\text{ cm}}\) and \({\text{M}}\) is the centre. \({\text{G}}\) is the mid-point of \({\text{CD}}\).
Write down an equation showing this information, taking \(b\) to be the cost of one tin of beans and \(c\) to be the cost of one packet of cereal in \({\text{AUD}}\).[1]
Stephen thinks that Mal has not bought enough so he buys \(12\) more tins of beans and \(6\) more packets of cereal. He pays \(66{\text{ AUD}}\).
Write down another equation to represent this information.[1]
Stephen thinks that Mal has not bought enough so he buys \(12\) more tins of beans and \(6\) more packets of cereal. He pays \(66{\text{ AUD}}\).
Find the cost of one tin of beans.[2]
(i) Sketch the graphs of the two equations from parts (a) and (b).
(ii) Write down the coordinates of the point of intersection of the two graphs.[4]
Using the letters on the diagram draw a triangle showing the position of a \({70^ \circ }\) angle.[1]
Show that the height of the pyramid is \(13.7{\text{ cm}}\), to 3 significant figures.[2]
Calculate
(i) the length of \({\text{EG}}\);
(ii) the size of angle \({\text{DEC}}\).[4]
Find the total surface area of the pyramid.[2]
Find the volume of the pyramid.[2]
Answer/Explanation
Markscheme
\(50b + 20c = 260\) (A1)[1 mark]
\(12b + 6c = 66\) (A1)[1 mark]
Solve to get \(b = 4\) (M1)(A1)(ft)(G2)
Note: (M1) for attempting to solve the equations simultaneously.[2 marks]
(i)
(A1)(A1)(A1)
Notes: Award (A1) for labels and some idea of scale, (A1)(ft)(A1)(ft) for each line.
The axis can be reversed.
(ii) \((4,3)\) or \((3,4)\) (A1)(ft)
Note: Accept \(b = 4\), \(c = 3\)[4 marks]
(A1)[1 mark]
\(\tan 70 = \frac{h}{5}\) (M1)
\(h = 5\tan 70 = 13.74\) (A1)
\(h = 13.7{\text{ cm}}\) (AG)[2 marks]
Unit penalty (UP) is applicable in this part of the question where indicated in the left hand column.
(i) \({\text{E}}{{\text{G}}^2} = {5^2} + {13.7^2}\) OR \({5^2} + {(5\tan 70)^2}\) (M1)
(UP) \({\text{EG}} = 14.6{\text{ cm}}\) (A1)(G2)
(ii) \({\text{DEC}} = 2 \times {\tan ^{ – 1}}\left( {\frac{5}{{14.6}}} \right)\) (M1)
\( = {37.8^ \circ }\) (A1)(ft)(G2)[4 marks]
Unit penalty (UP) is applicable in this part of the question where indicated in the left hand column.
\({\text{Area}} = 10 \times 10 + 4 \times 0.5 \times 10 \times 14.619\) (M1)
(UP) \( = 392{\text{ c}}{{\text{m}}^2}\) (A1)(ft)(G2)[2 marks]
Unit penalty (UP) is applicable in this part of the question where indicated in the left hand column.
\({\text{Volume}} = \frac{1}{3} \times 10 \times 10 \times 13.7\) (M1)
(UP) \( = 457{\text{ c}}{{\text{m}}^3}\) (\(458{\text{ c}}{{\text{m}}^3}\)) (A1)(G2)[2 marks]