Question
[Maximum mark: 14]
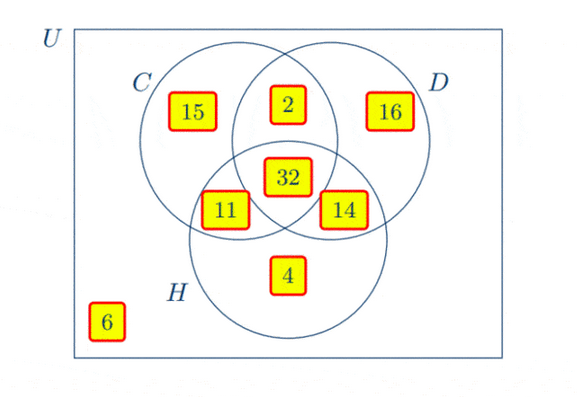
100 students are asked what pets they like from a choice of cats, dogs and hamsters. The results are as follows.
$\text{60 like cats}$
$\text{64 like dogs}$
$\text{61 like hamsters}$
$\text{34 like cats and dogs}$
$\text{46 like dogs and hamsters}$
$\text{43 like cats and hamsters}$
$\text{32 like cats, dogs and hamsters}$
(a) Represent this information on a Venn diagram. [4]
(b) Find the number of students who
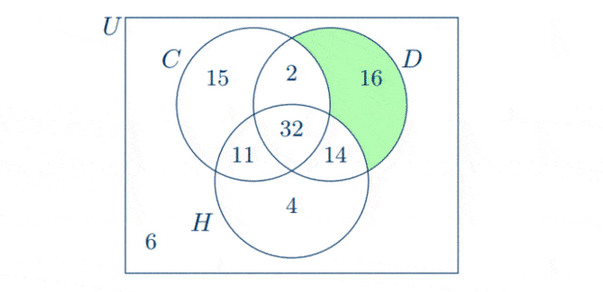
(i) like dogs only;
(ii) like both dogs and cats but not hamsters;
(iii) do not like pets. [6]
A student is randomly chosen from this group of 100 students.
(c) Calculate the probability that this student likes only two kinds of pets. [2]
(d) Calculate the probability that this student likes only dogs, given that this student only likes one kind of pet. [2]
Answer/Explanation
(a)

(b) (i) The region shaded in the Venn diagram below represents those who like dogs only.

So the number of students who like dogs only is
$
n\left(D \cap C^{\prime} \cap H^{\prime}\right)=16
$
Question
[Maximum mark: 16]
The following table shows the total revenue, $y$, in Australian dollars (AUD), obtained daily during the first week of January 2020, by Peppy’s Pizza restaurant and the number of guests, $x$, served.
(a) (i) Calculate the Pearson’s product-moment correlation coefficient, $r$, for this data.
(ii) Hence comment on the result. [4]
(b) Write down the equation of the regression line $y$ on $x$. [2]
(c) Use the line of the regression to estimate the revenue of serving 70 guests. Give your answer correct to the nearest AUD. [3]
Daily maintenance cost for the restaurant is 240 AUD. Additionally, the cost of serving one guest is 5 AUD.
(d) Determine if the restaurant makes a profit when serving 45 guests on a particular day. [2]
(e) (i) Write down an expression for the total revenue of serving $x$ guests.
(ii) Find an expression for the profit of the restaurant when serving $x$ guests on a particular day.
(iii) Find the least number of guests required to be served to result in a profit for the day. [5]
Answer/Explanation
(a) (i) $r=0.991$ $\text{[by using G.D.C.]}$
(ii) Positive, strong correlation $\mathrm{b} / \mathrm{n}$ the number of guests and revenue
(b) $y=10.4 x-14.3$ $\text{[by using G.D.C.]}$
(c) Evaluating $y=10.4 x-14.3$ for $x=70$, we get
$
\begin{aligned}
y & =10.4(70)-14.3 \\
& =713.7 \\
& \approx 714 \mathrm{AUD}
\end{aligned}
$
(d) The profit of the restaurant when serving 45 guests on a particular day is
$
\begin{aligned}
\text { Profit } & =\text { Revenue }-\text { Costs } \\
& =410-(240+5(45)) \\
& =-55 \text { AUD }
\end{aligned}
$
Hence the restaurant makes a loss when serving only 45 guests.
