Question
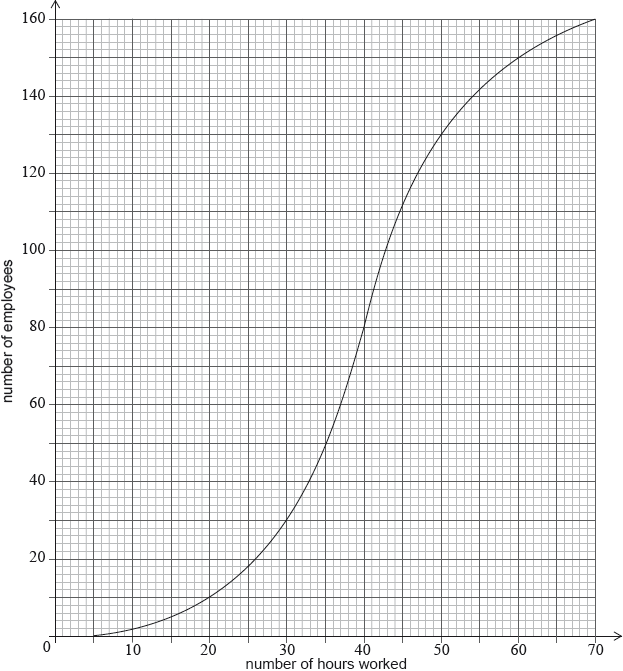
A city hired 160 employees to work at a festival. The following cumulative frequency curve shows the number of hours employees worked during the festival.

The city paid each of the employees £8 per hour for the first 40 hours worked, and £10 per hour for each hour they worked after the first 40 hours.
Find the median number of hours worked by the employees.
Write down the number of employees who worked 50 hours or less.
Find the amount of money an employee earned for working 40 hours;
Find the amount of money an employee earned for working 43 hours.
Find the number of employees who earned £200 or less.
Only 10 employees earned more than £\(k\). Find the value of \(k\).
Answer/Explanation
Markscheme
evidence of median position (M1)
eg\(\,\,\,\,\,\)80th employee
40 hours A1 N2
[2 marks]
130 employees A1 N1
[1 mark]
£320 A1 N1
[1 mark]
splitting into 40 and 3 (M1)
eg\(\,\,\,\,\,\)3 hours more, \(3 \times 10\)
correct working (A1)
eg\(\,\,\,\,\,\)\(320 + 3 \times 10\)
£350 A1 N3
[3 marks]
valid approach (M1)
eg\(\,\,\,\,\,\)200 is less than 320 so 8 pounds/hour, \(200 \div 8,{\text{ }}25,{\text{ }}\frac{{200}}{{320}} = \frac{x}{{40}}\),
18 employees A2 N3
[3 marks]
valid approach (M1)
eg\(\,\,\,\,\,\)\(160 – 10\)
60 hours worked (A1)
correct working (A1)
eg\(\,\,\,\,\,\)\(40(8) + 20(10),{\text{ }}320 + 200\)
\(k = 520\) A1 N3
[4 marks]
Question
The following box-and-whisker plot shows the number of text messages sent by students in a school on a particular day.
Find the value of the interquartile range.
One student sent k text messages, where k > 11 . Given that k is an outlier, find the least value of k.
Answer/Explanation
Markscheme
recognizing Q1 or Q3 (seen anywhere) (M1)
eg 4,11 , indicated on diagram
IQR = 7 A1 N2
[2 marks]
recognizing the need to find 1.5 IQR (M1)
eg 1.5 × IQR, 1.5 × 7
valid approach to find k (M1)
eg 10.5 + 11, 1.5 × IQR + Q3
21.5 (A1)
k = 22 A1 N3
Note: If no working shown, award N2 for an answer of 21.5.
[4 marks]